Production plan OR-Tools
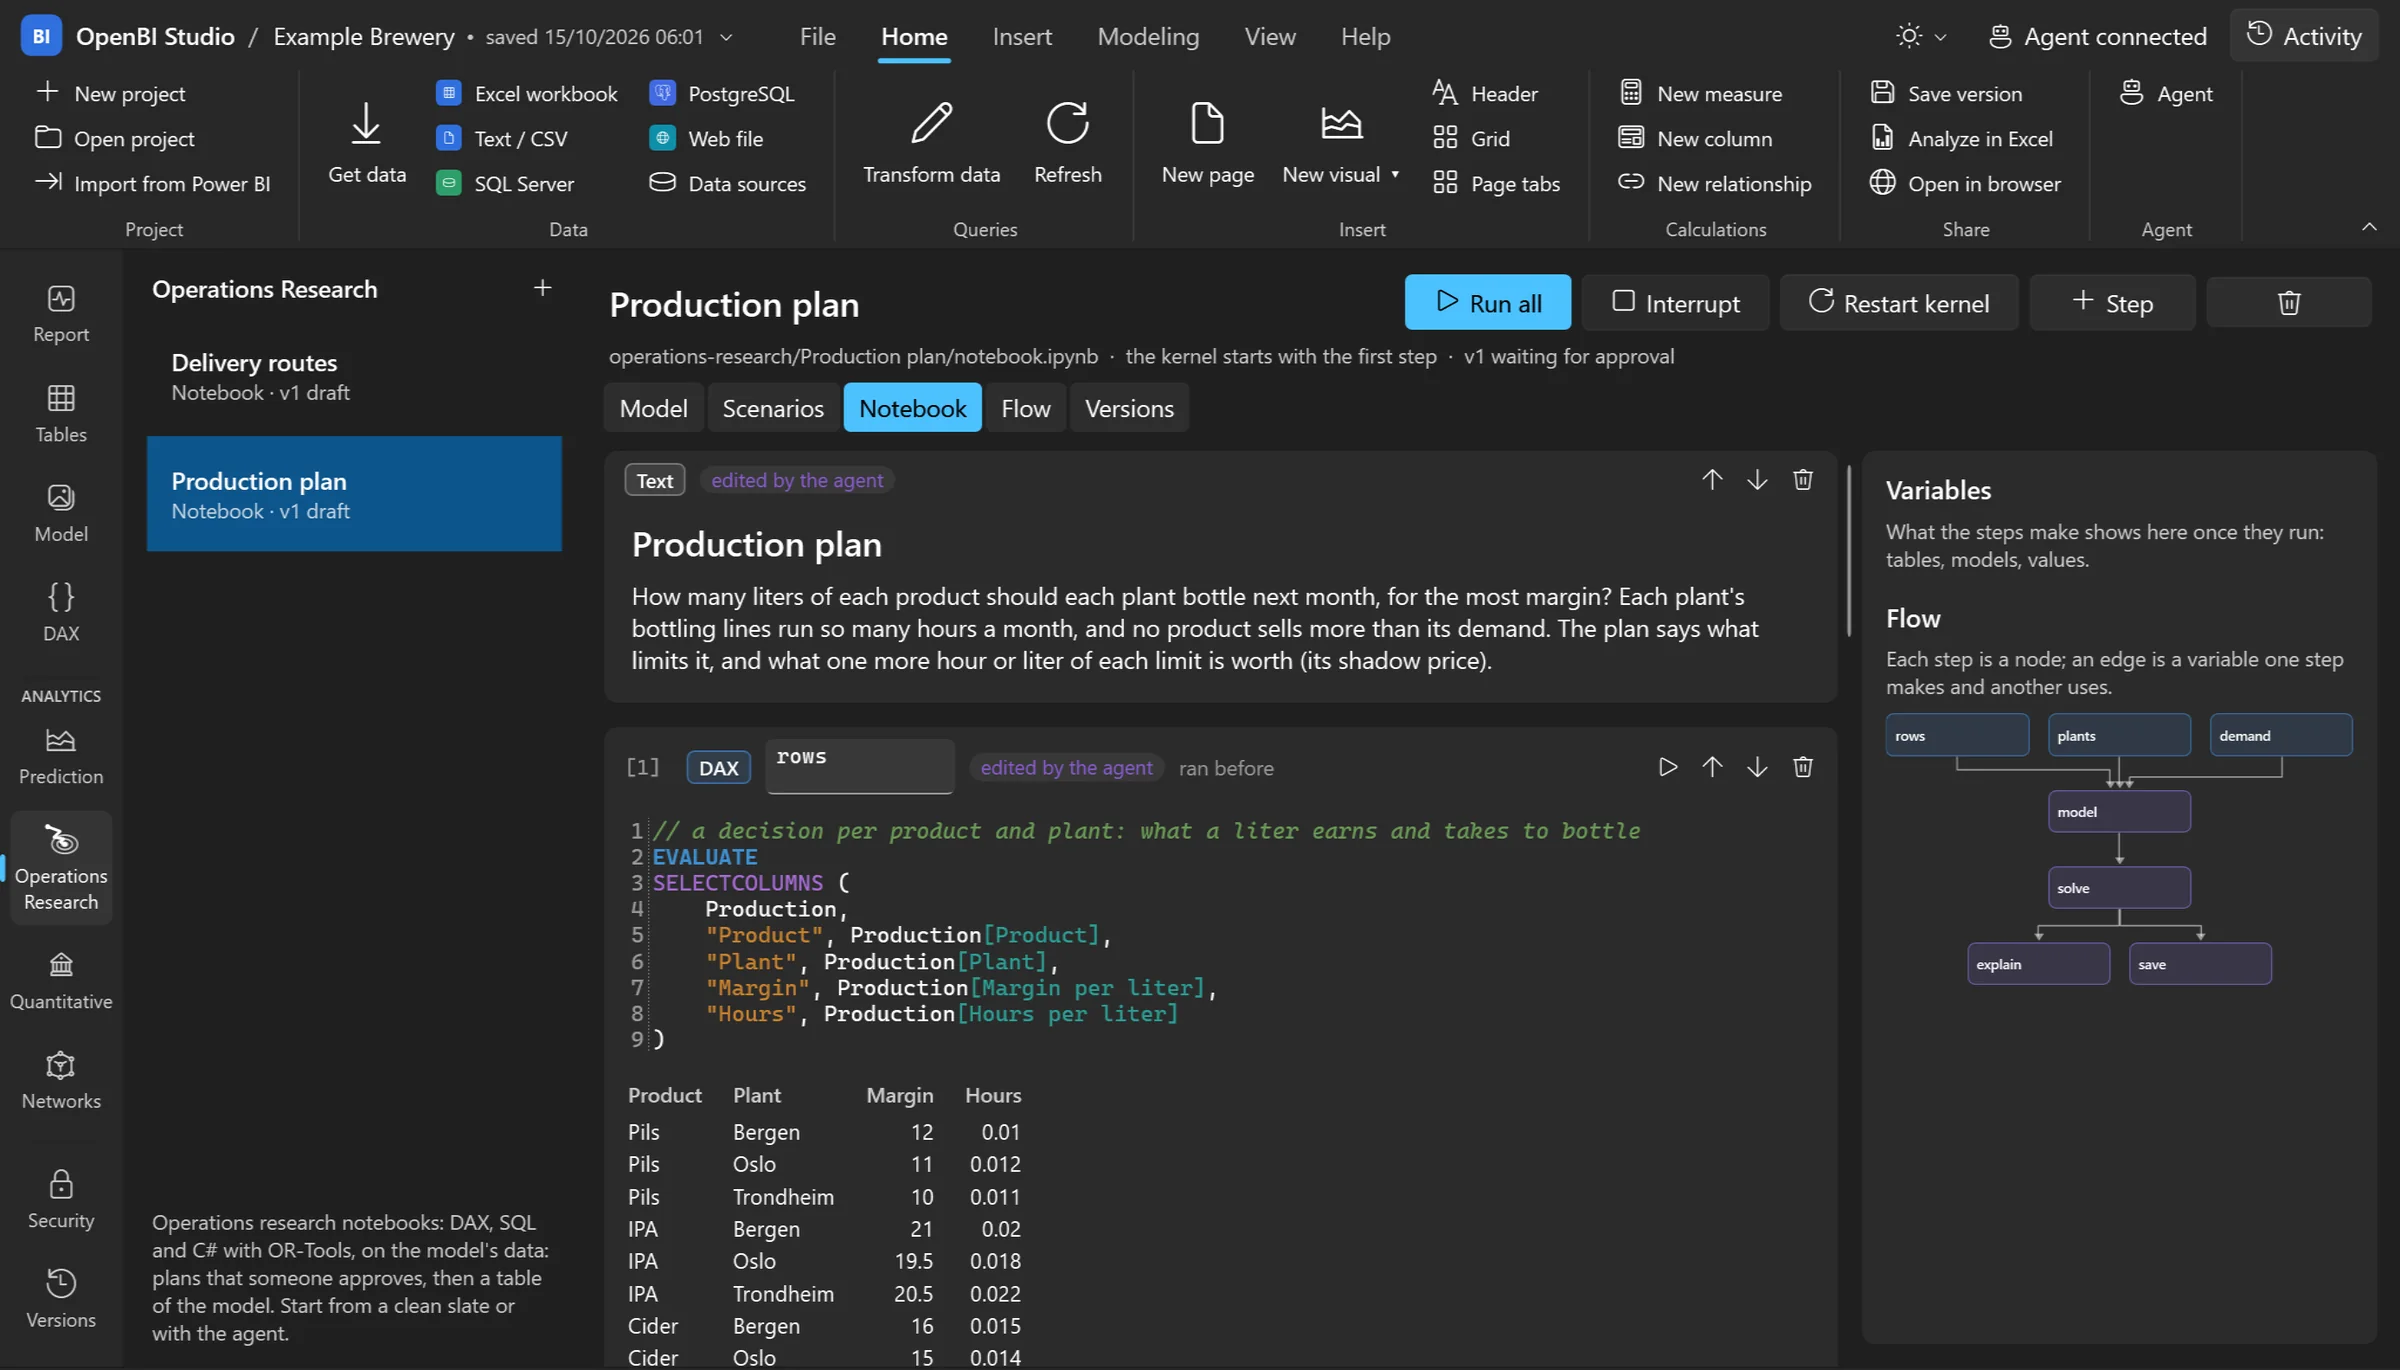
- Optimal: margin 4,068,409.
- Bottling hours in Bergen are at their limit (1,600): one more adds 75 to the margin.
- IPA demand is at its limit (60,000): one more liter adds 19.5.
A BI engine and studio in one install. Your organization's measures live in a semantic model, so any agent — Claude, ChatGPT, Grok or your own — answers with numbers it cannot make up. No Python. No R. Nothing to pip install.
Why another BI tool
They were built for people at a keyboard, one package at a time — and they are wonderful at that. But an agent doesn't need a REPL and forty dependencies. It needs one engine that answers in milliseconds, and says no when a name doesn't exist.
OpenBI's engine is written in C. DAX, SQL and Power Query run inside it, and so do the libraries that do the heavy lifting — DuckDB, OR-Tools, QuantLib, igraph, LightGBM and Typst. One engine, one model, one answer.
“The fastest dependency is the one you never installed.”
Your wingman
You're never alone. DAX, M, MDX, SQL — the syntax you used to fight is a thing of the past. Ask in words; your agent writes the query, OpenBI checks it against the model, and the answer comes back in words.
 OpenBI Studio — the DAX view
Connect any agent in one line (the studio shows yours, with its own key):
claude mcp add --transport http openbi-studio http://127.0.0.1:5739/mcp \
  --header "Authorization: Bearer <your studio's key>"
Other agents take the same address as JSON. The studio says when one is connected, and how many calls it made.
The agent's explanations, word for word, from the studio's explain tool on the example project.
The semantic model
Like SQL, Open Analytics Expression (OAX) is exact: a query names measures and columns that exist, or it fails. Your organization's measures, relationships, roles and calendars live in one semantic model — written once, by people who know what “revenue” means — and every agent uses the same definitions.
A replay of the example project's answers, recorded from OpenBI. The misspelt names are refused exactly as the engine refuses them.


Versions
Every change — yours or the agent's — is tracked in git and saved as versions you name. The model is text, so a change reads like a sentence, and going back is one click.
The real sequence, from the example project — the agent made the mistake on purpose.


Trust, but log


The visuals
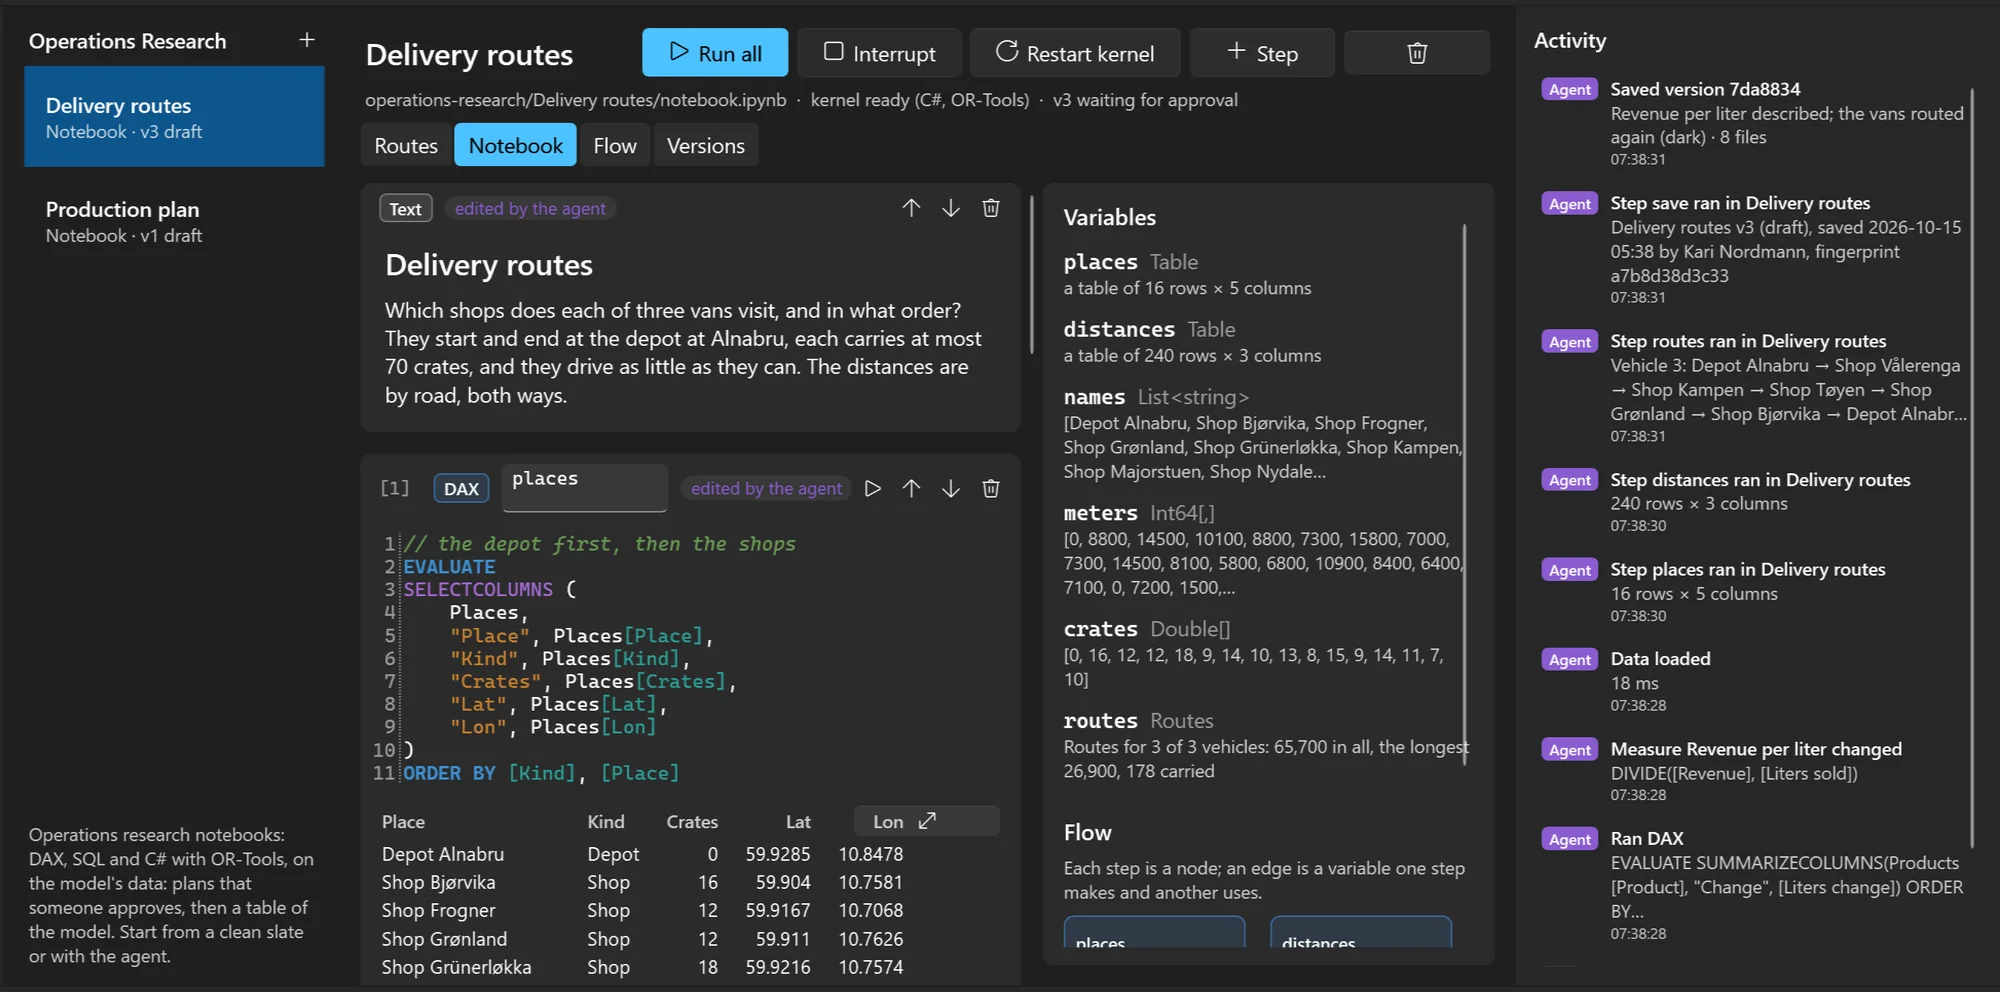
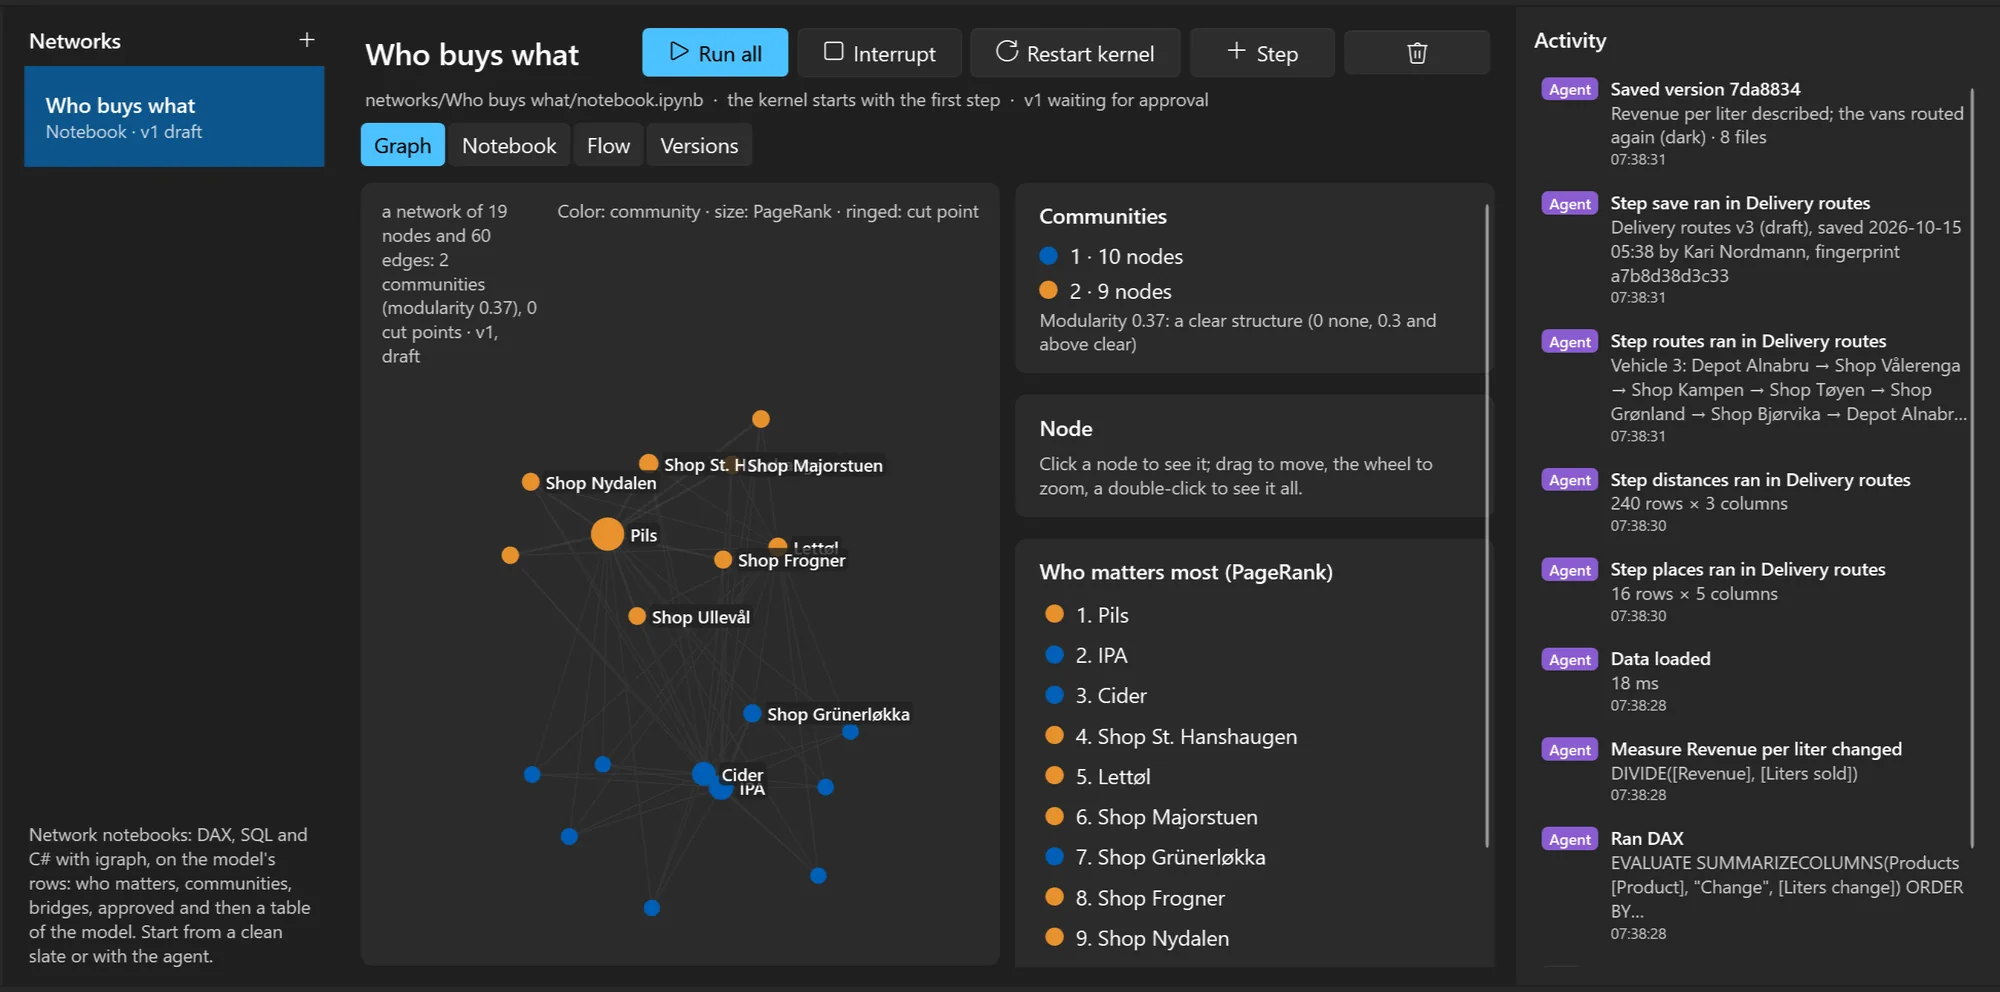
Every picture below is OpenBI drawing the example project — captured, not mocked up. Flip the owl switch and they all turn dark, because the visuals do too.
Chart themes
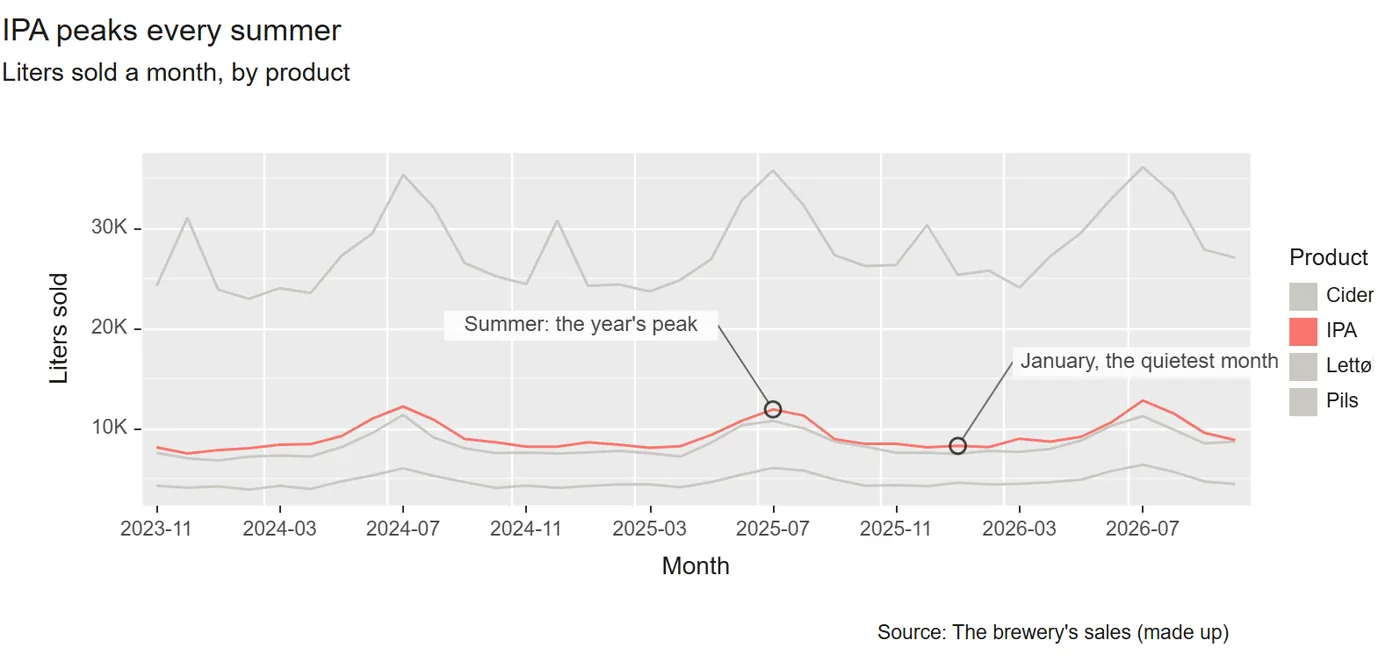
Or something more serious? Nine looks, one attribute on the page — the same chart, the same data, drawn by OpenBI in each.
Are you an owl?
We have a dark theme — for the studio, the reports and this page.
Financial reporting
A chart of accounts read as a parent-child tree, added up by its operators. Actual against budget and last year, variance bars, comments on figures — and out the other end, Excel with live formulas, or a typeset PDF.
 The same statement as a typeset PDF · move to zoom
Totals and variances as formulas, the rows as an outline, the figures exact with the scale in their number format.
Typst on the server: rules, a double rule under the total, headings on every page, comments as footnotes. PDF/A on request.
Right-click a figure to comment. Kept with the report, who and when, under the selection they were written for.
Formulas
Write formulas in TeX on any report page, and put the model's live values in them with \val{[Measure]} — they follow the page's filters. Below is the same renderer OpenBI ships. Type away.


One tool
Operations research, quantitative finance, network analysis and prediction — next to OAX, SQL and Open Query, in the same engine, on the same model. No second runtime, no extra packages.
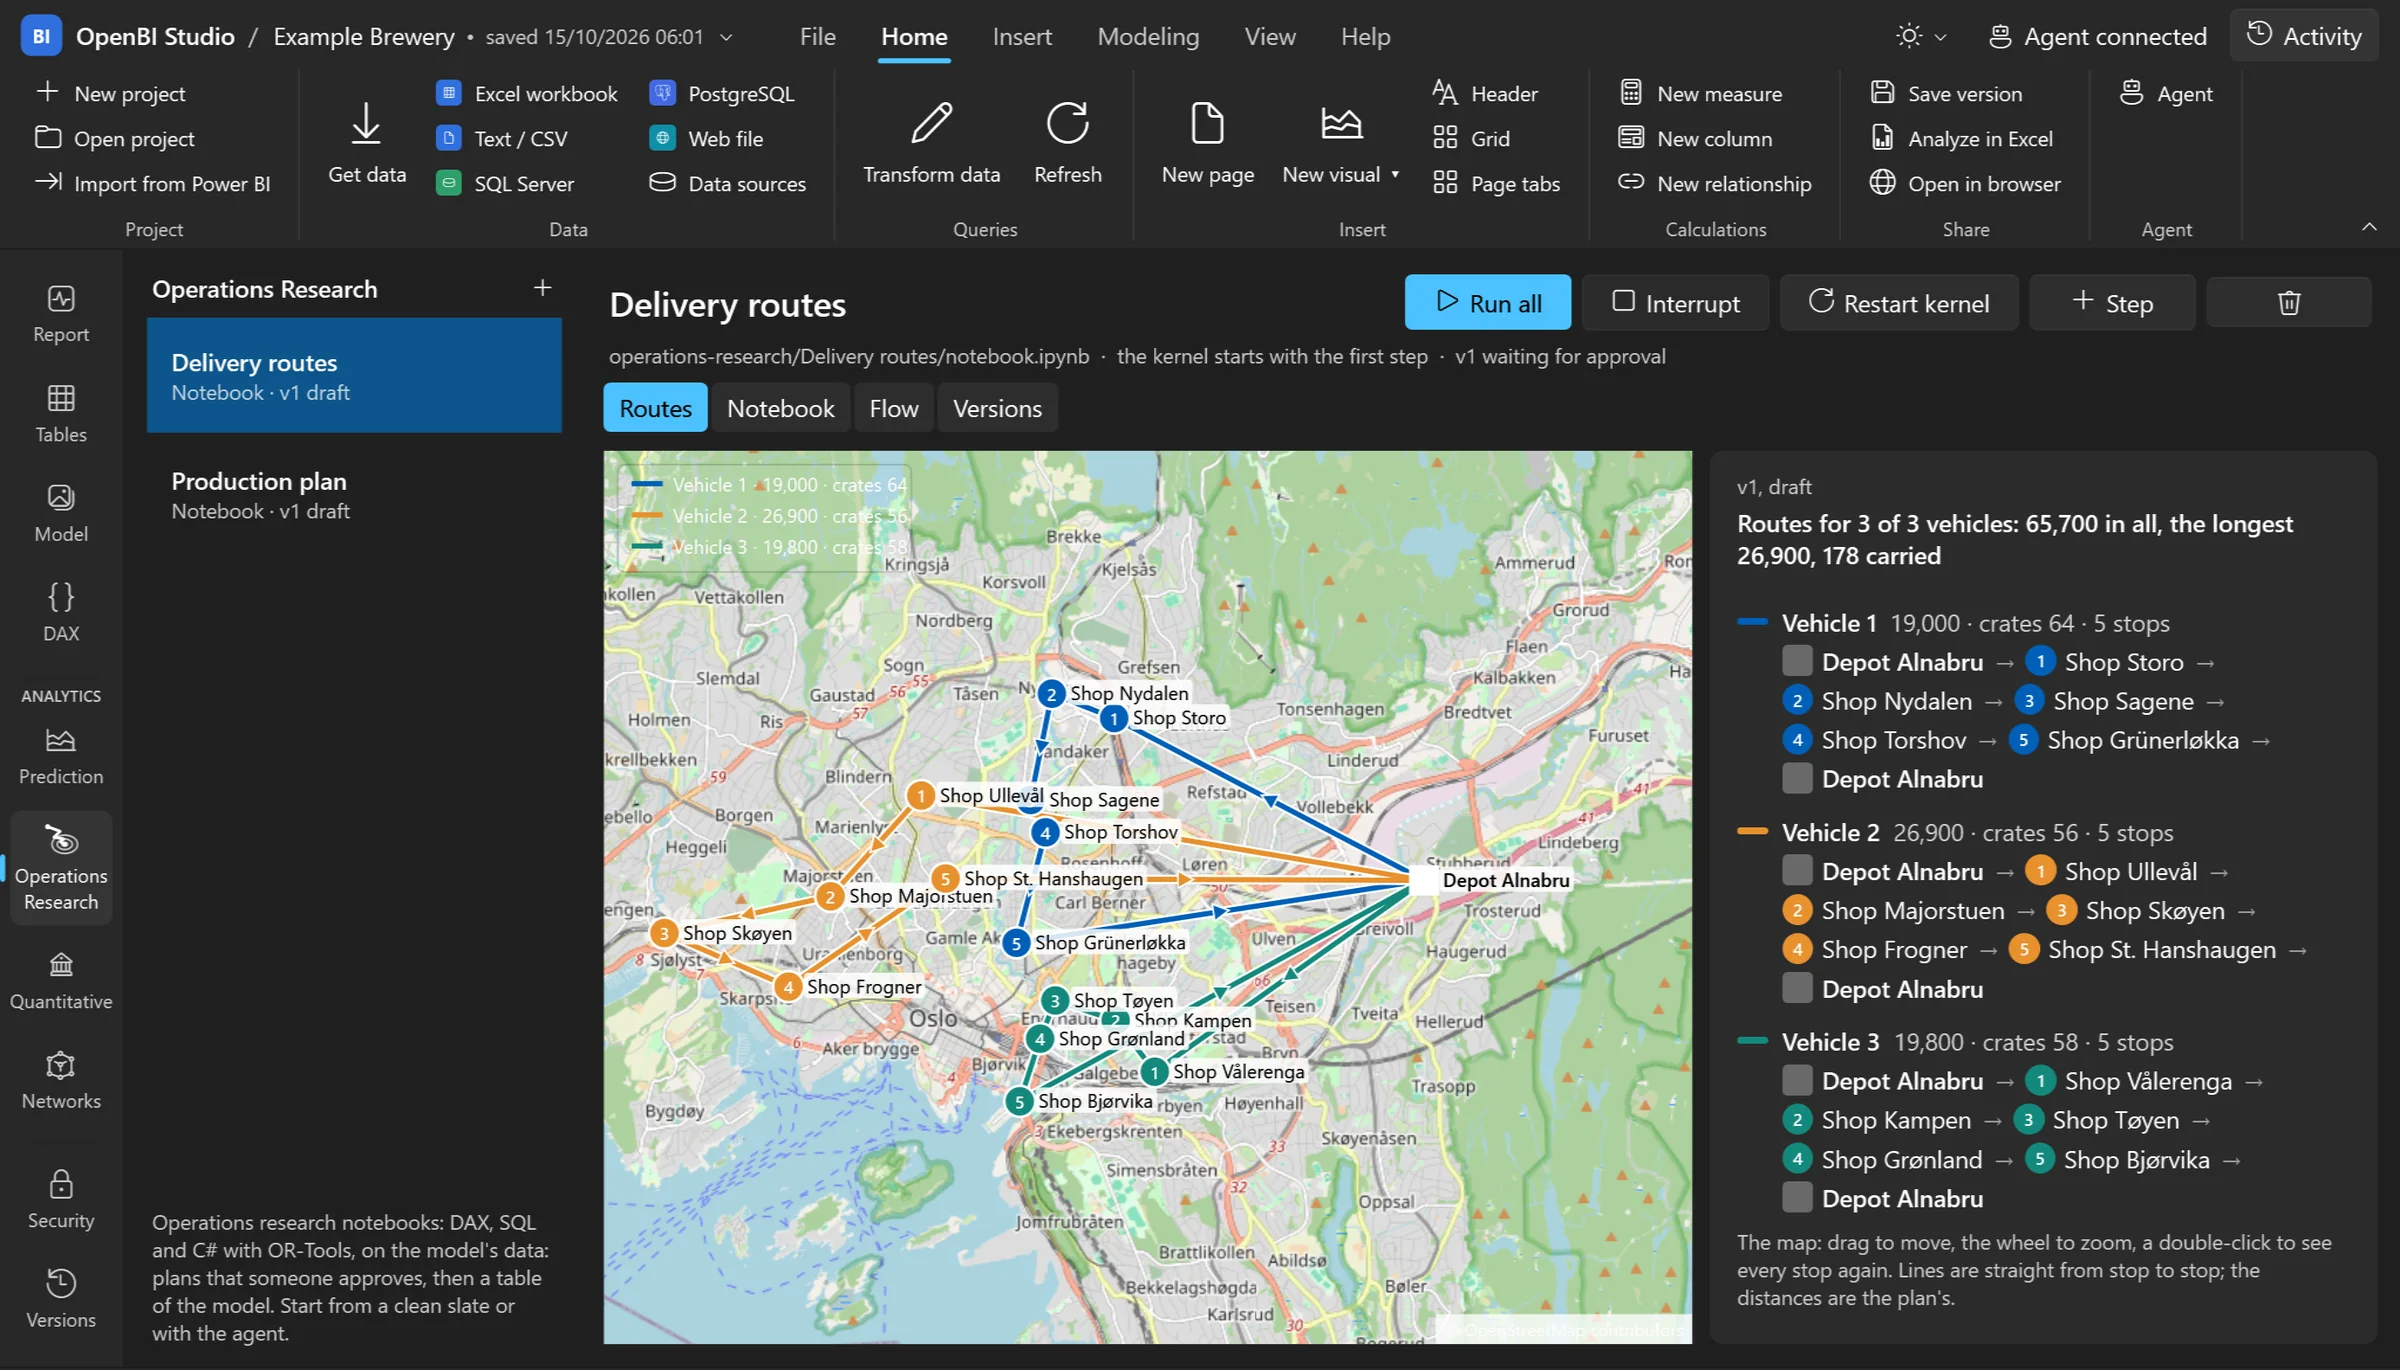
Production plans, vehicle routes, schedules — with what limits them and what one more of each is worth.
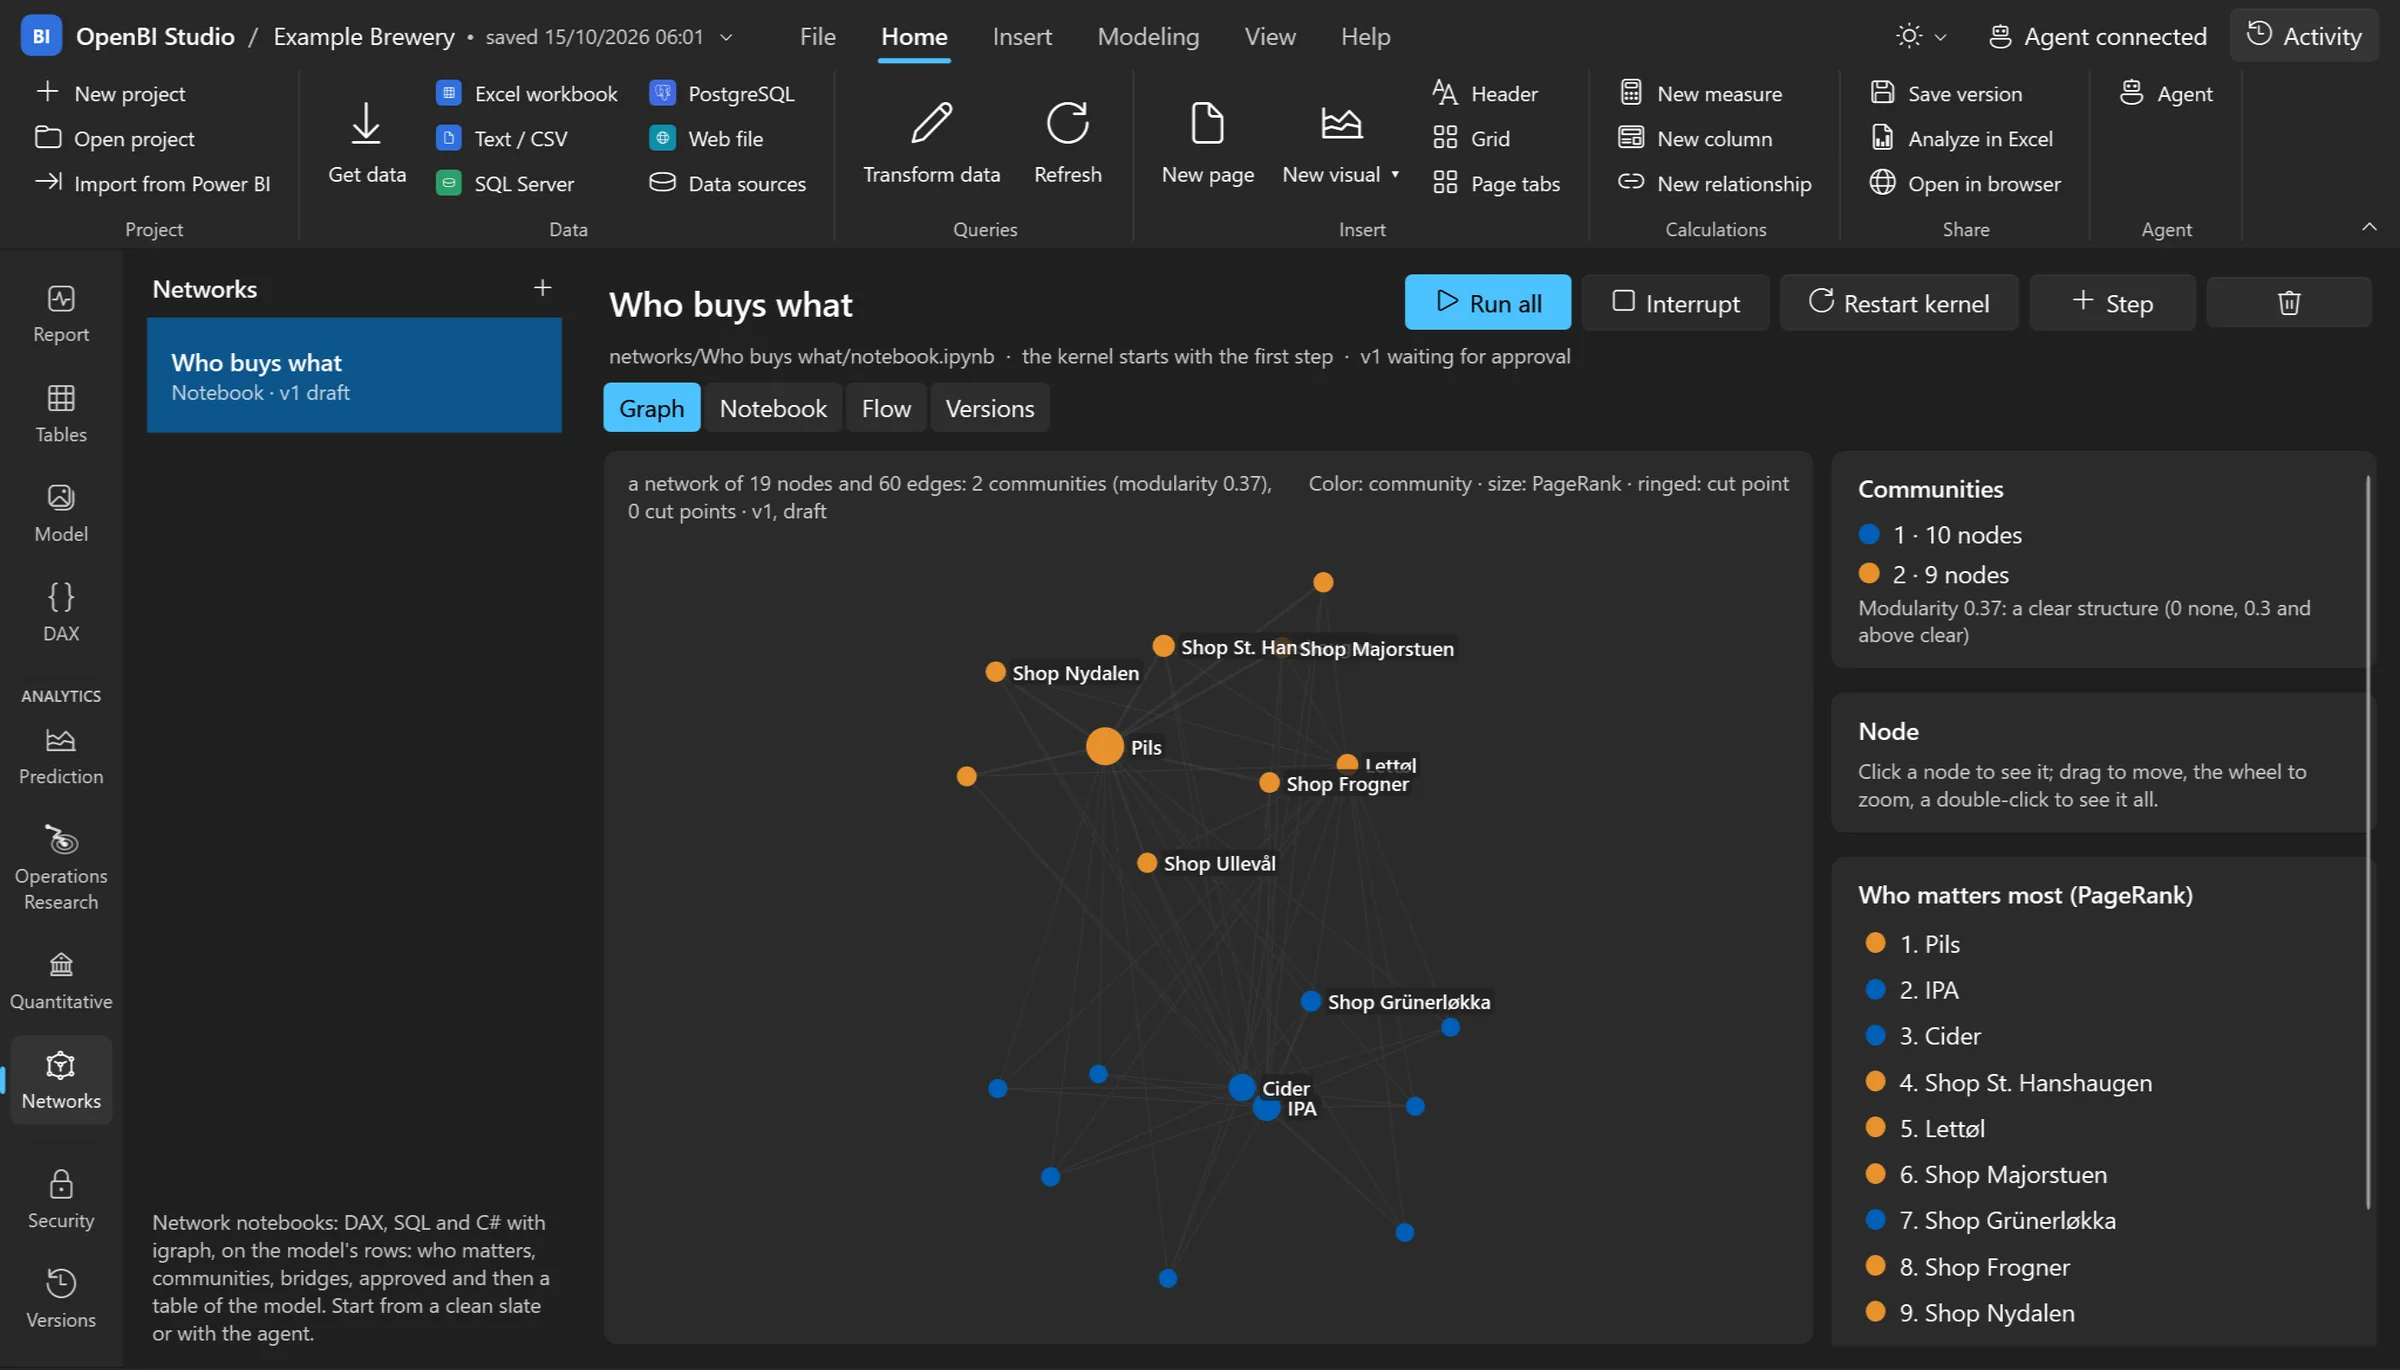
Communities, centrality, bridges — who matters, and why.
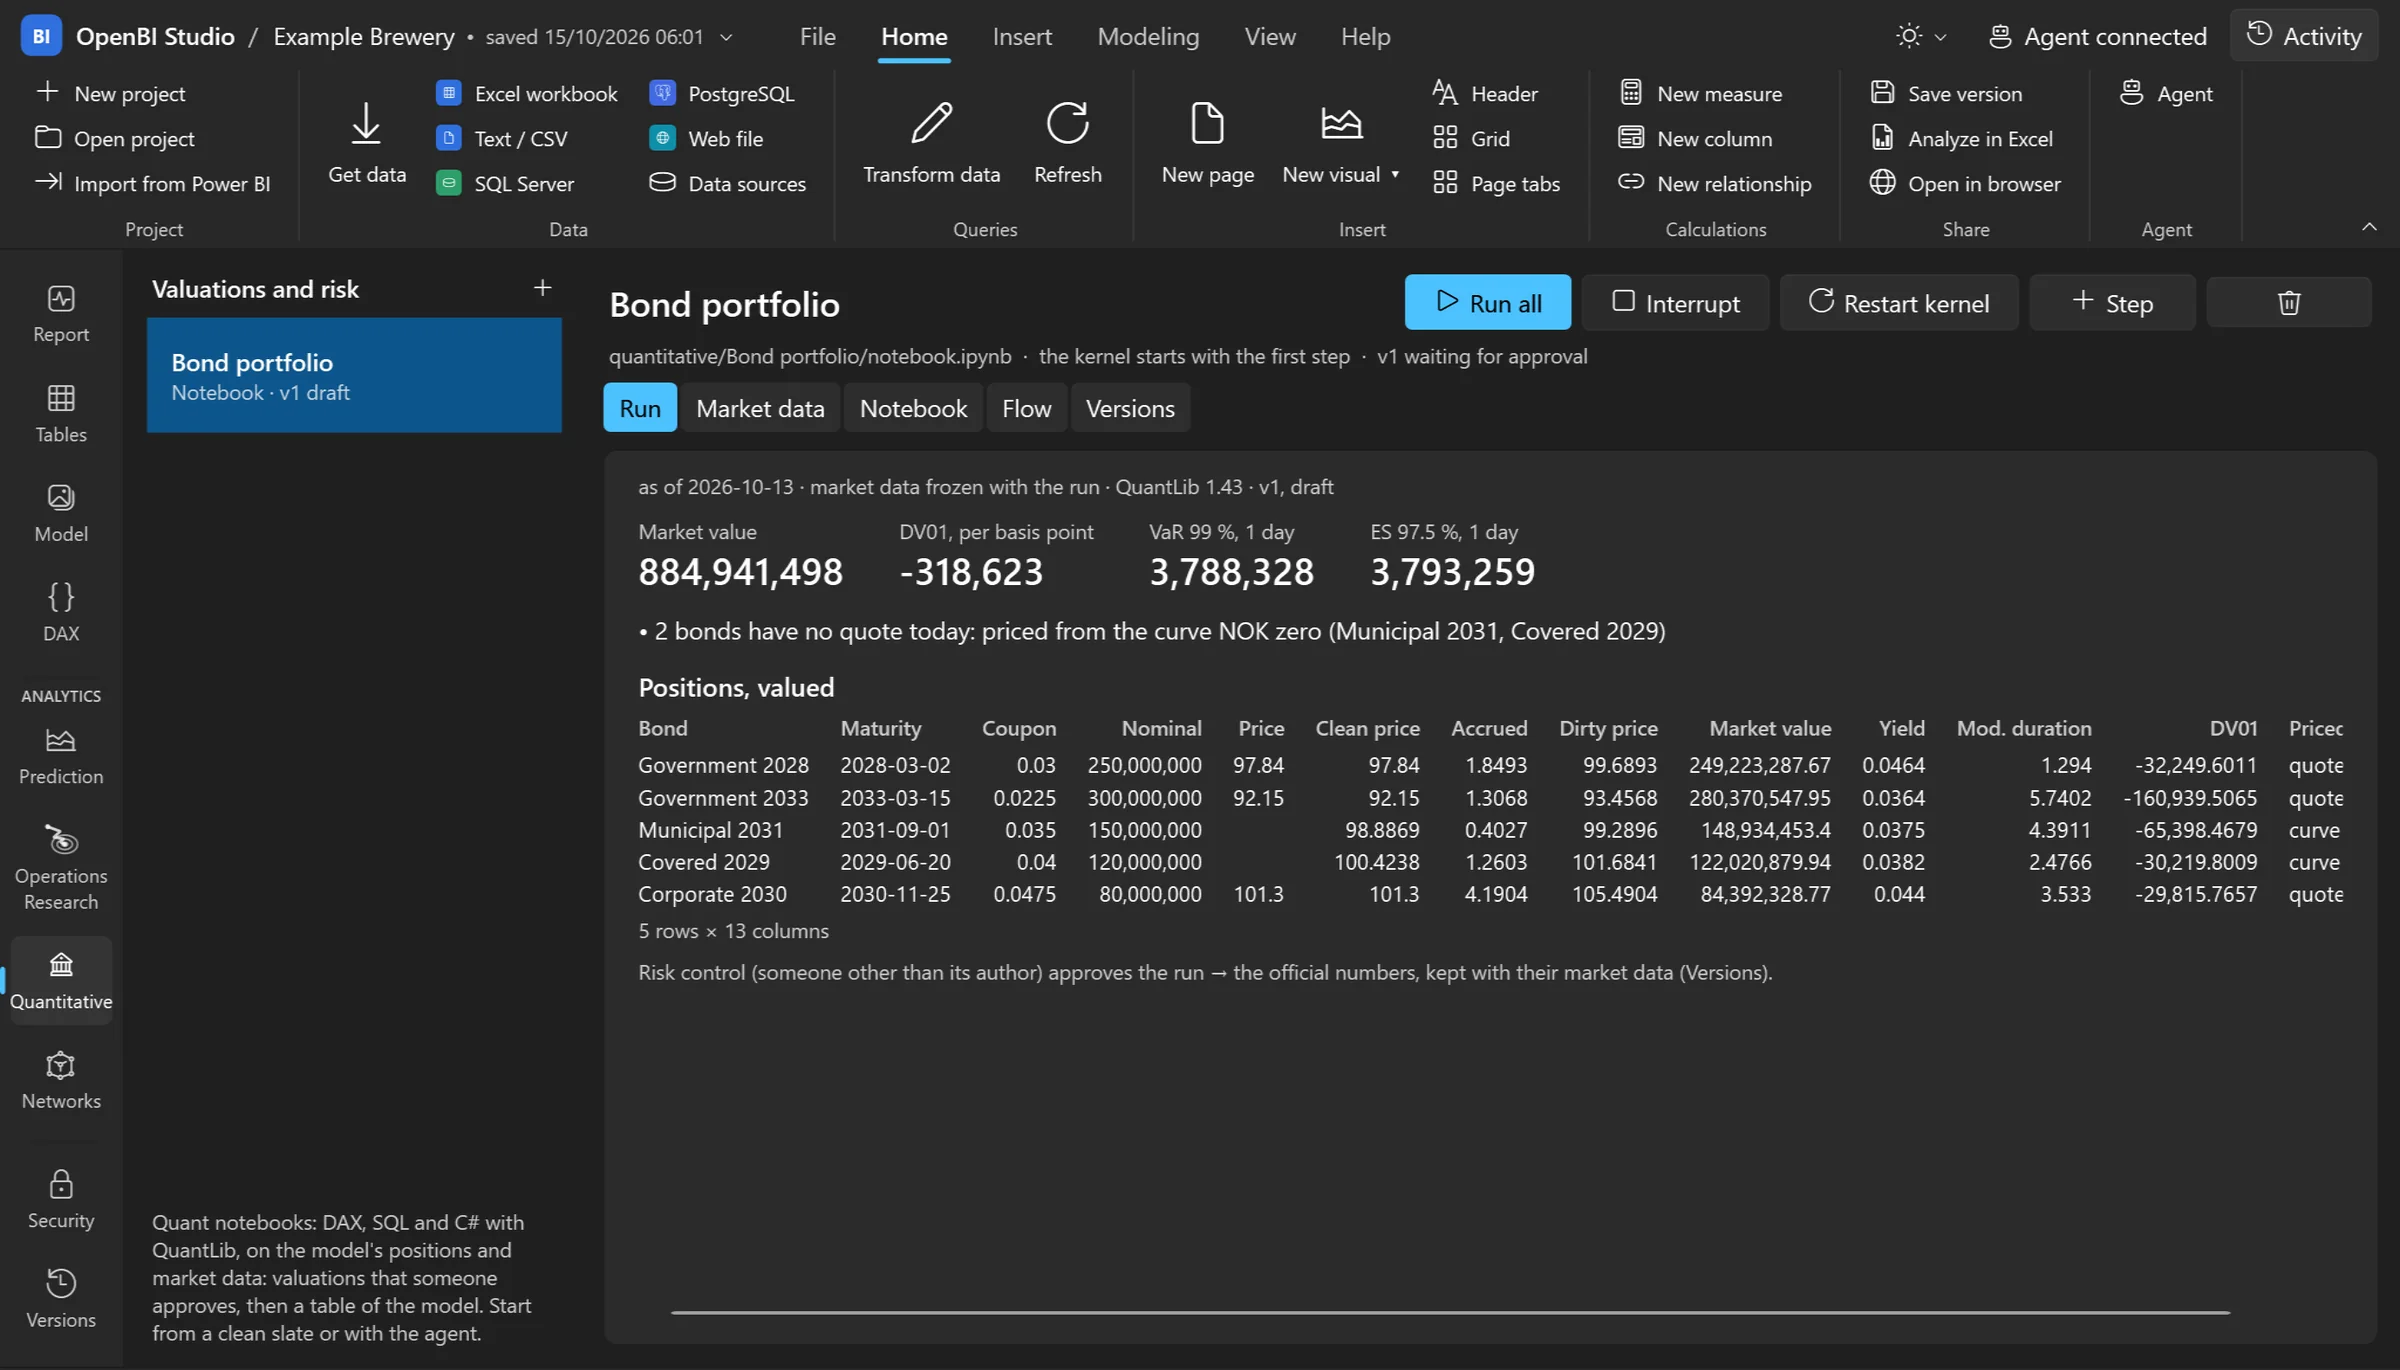
Curves, bonds, options, FX, VaR — and QUANT.* functions right in DAX.
DAX, SQL and C# steps, versioned and approved by a person before they reach the model.
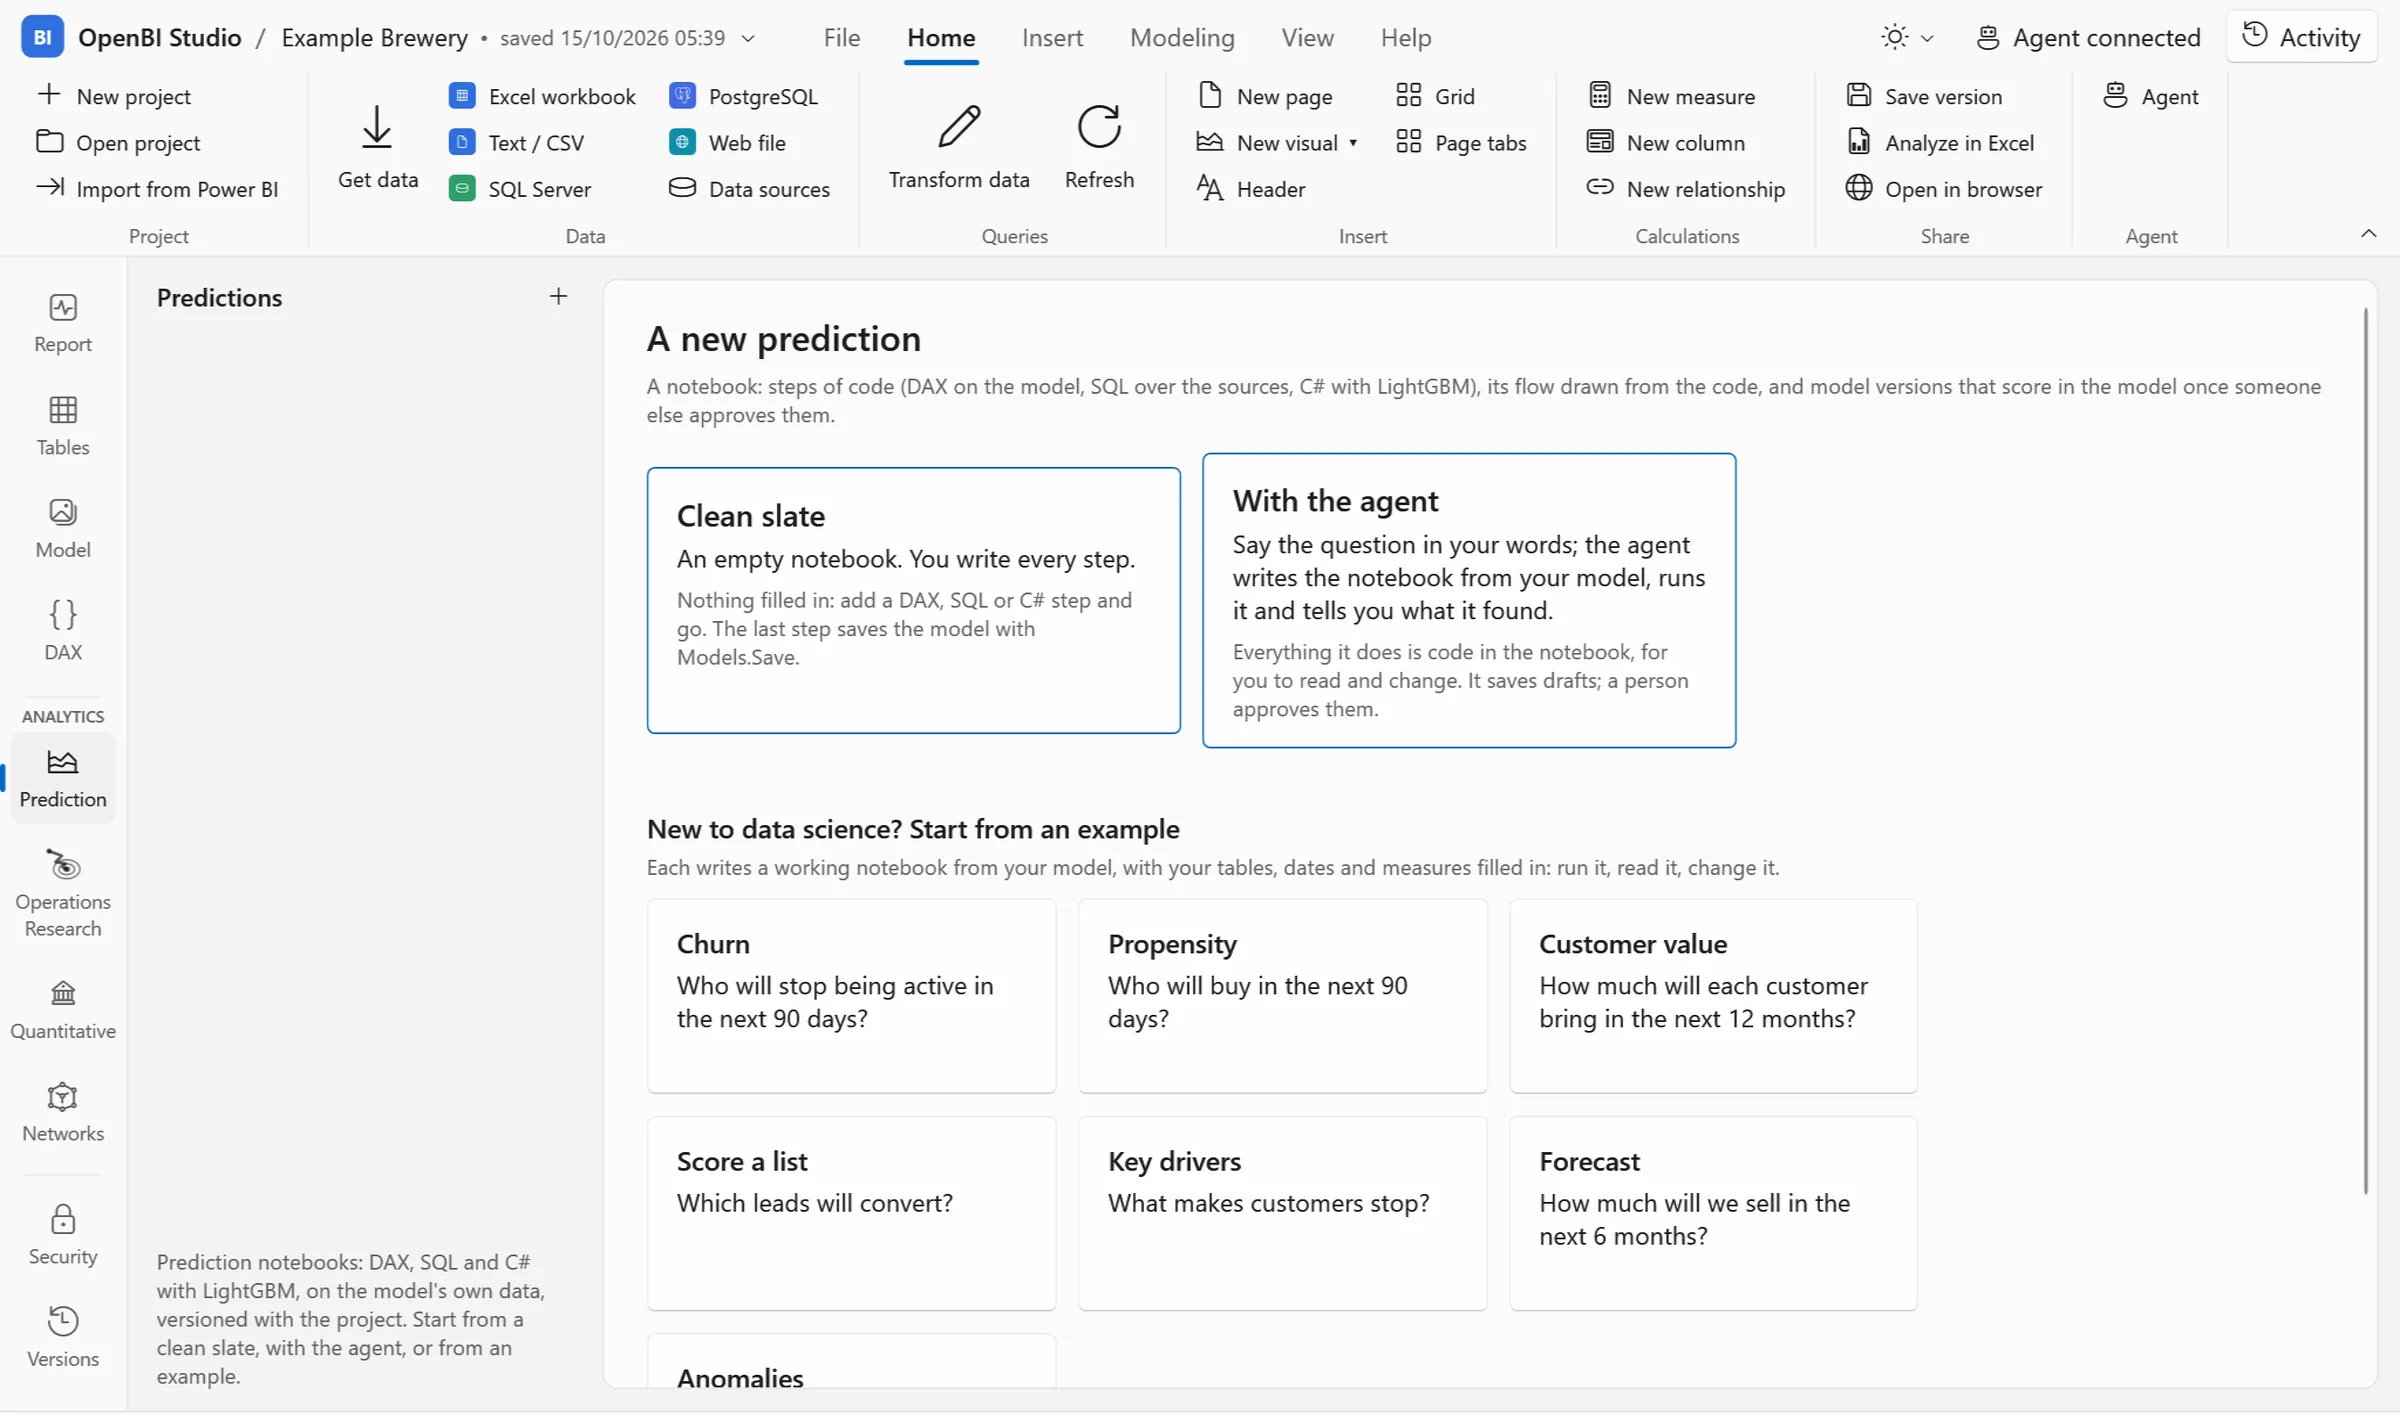
Churn, propensity, forecasts — trained on the model's history, scored with PREDICT() in DAX.
Notebooks
Forecasts with LightGBM, valuations with QuantLib, plans and routes with OR-Tools, networks with igraph — each a notebook of OAX, SQL and C# steps that runs on your own computer, beside the model. No cluster to rent, no cores billed by the hour, and your data stays where it is.
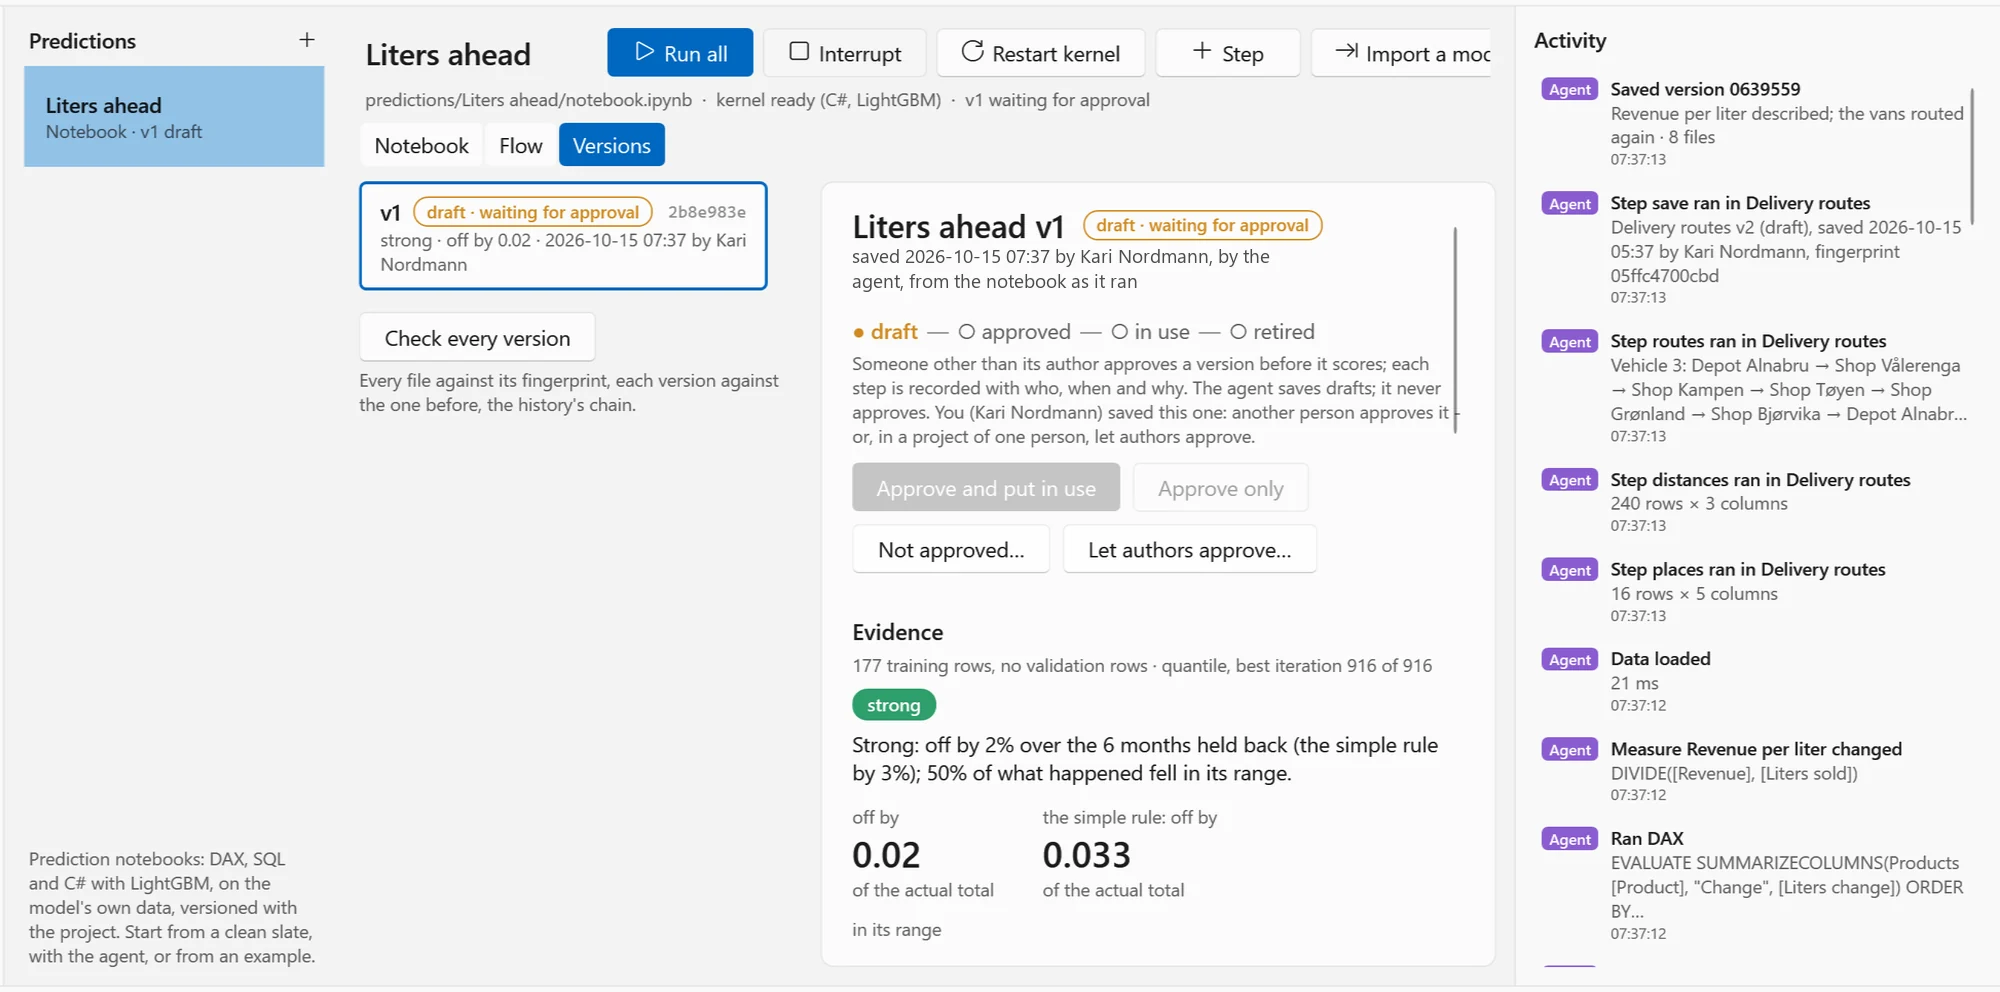
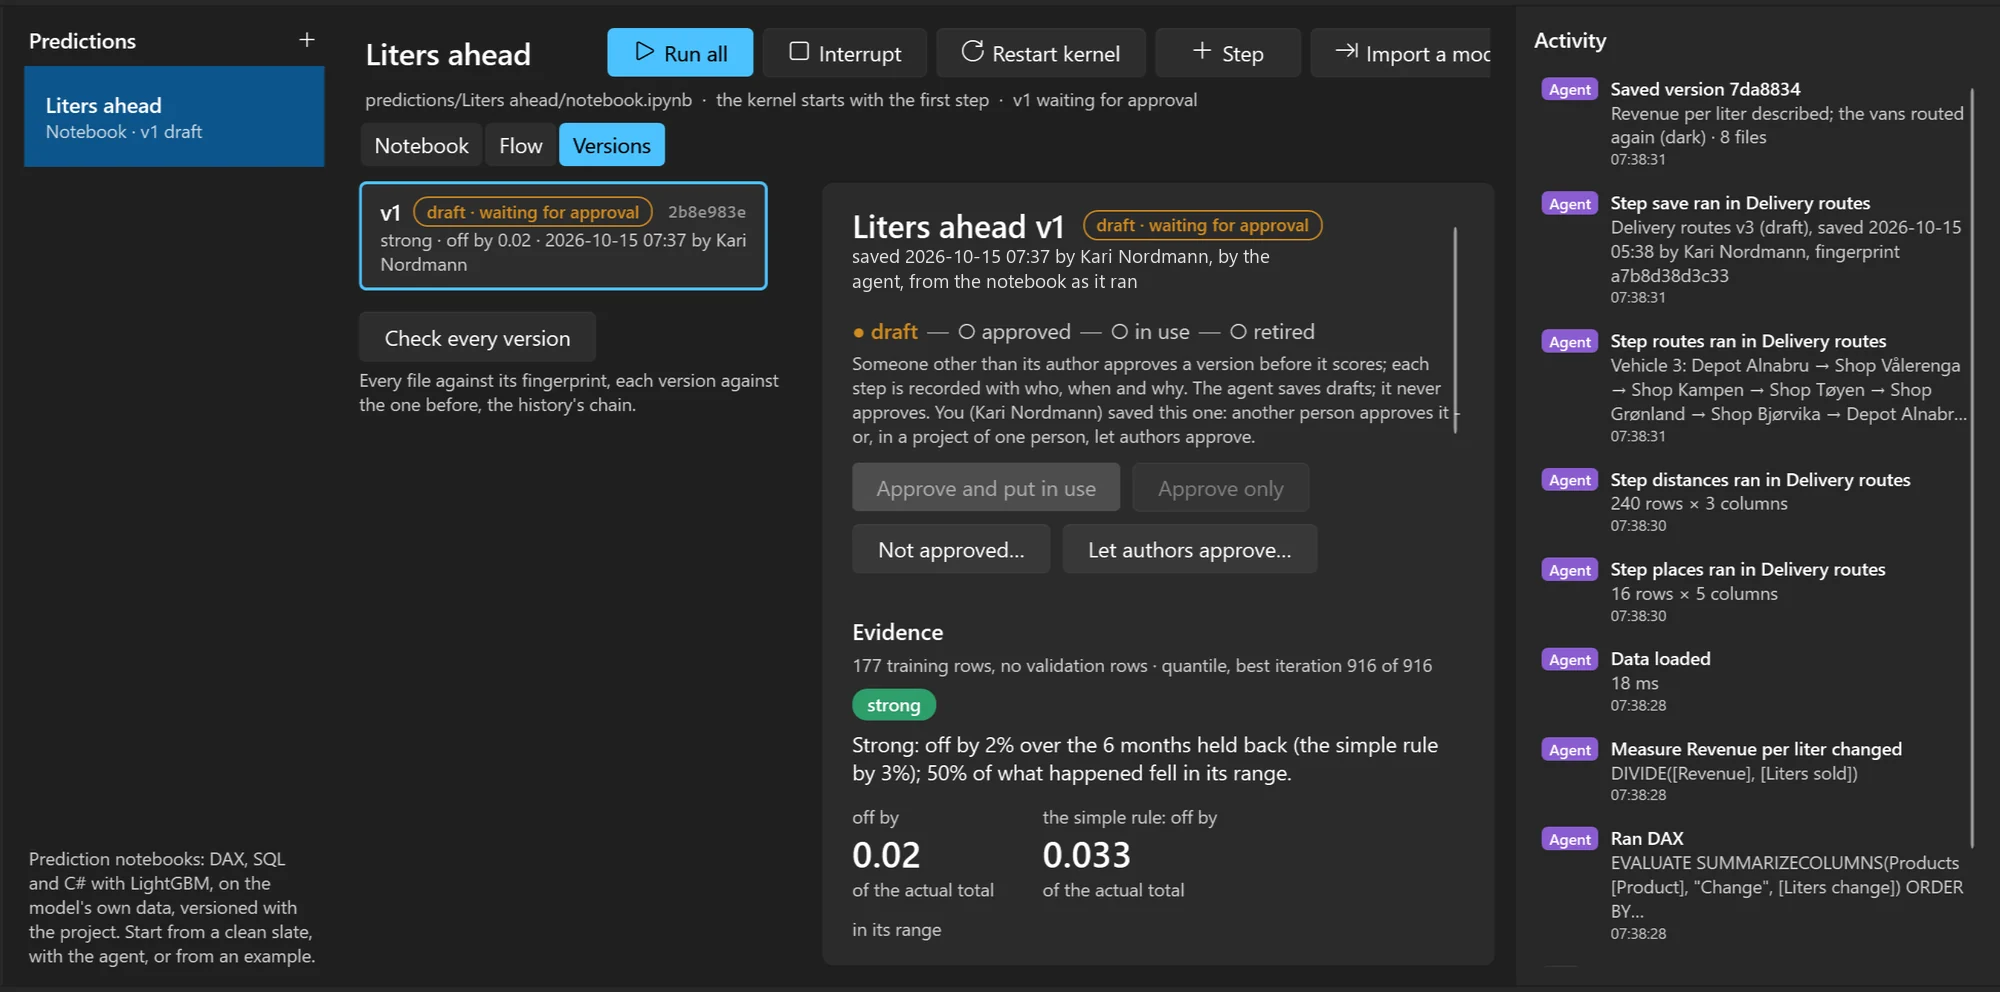
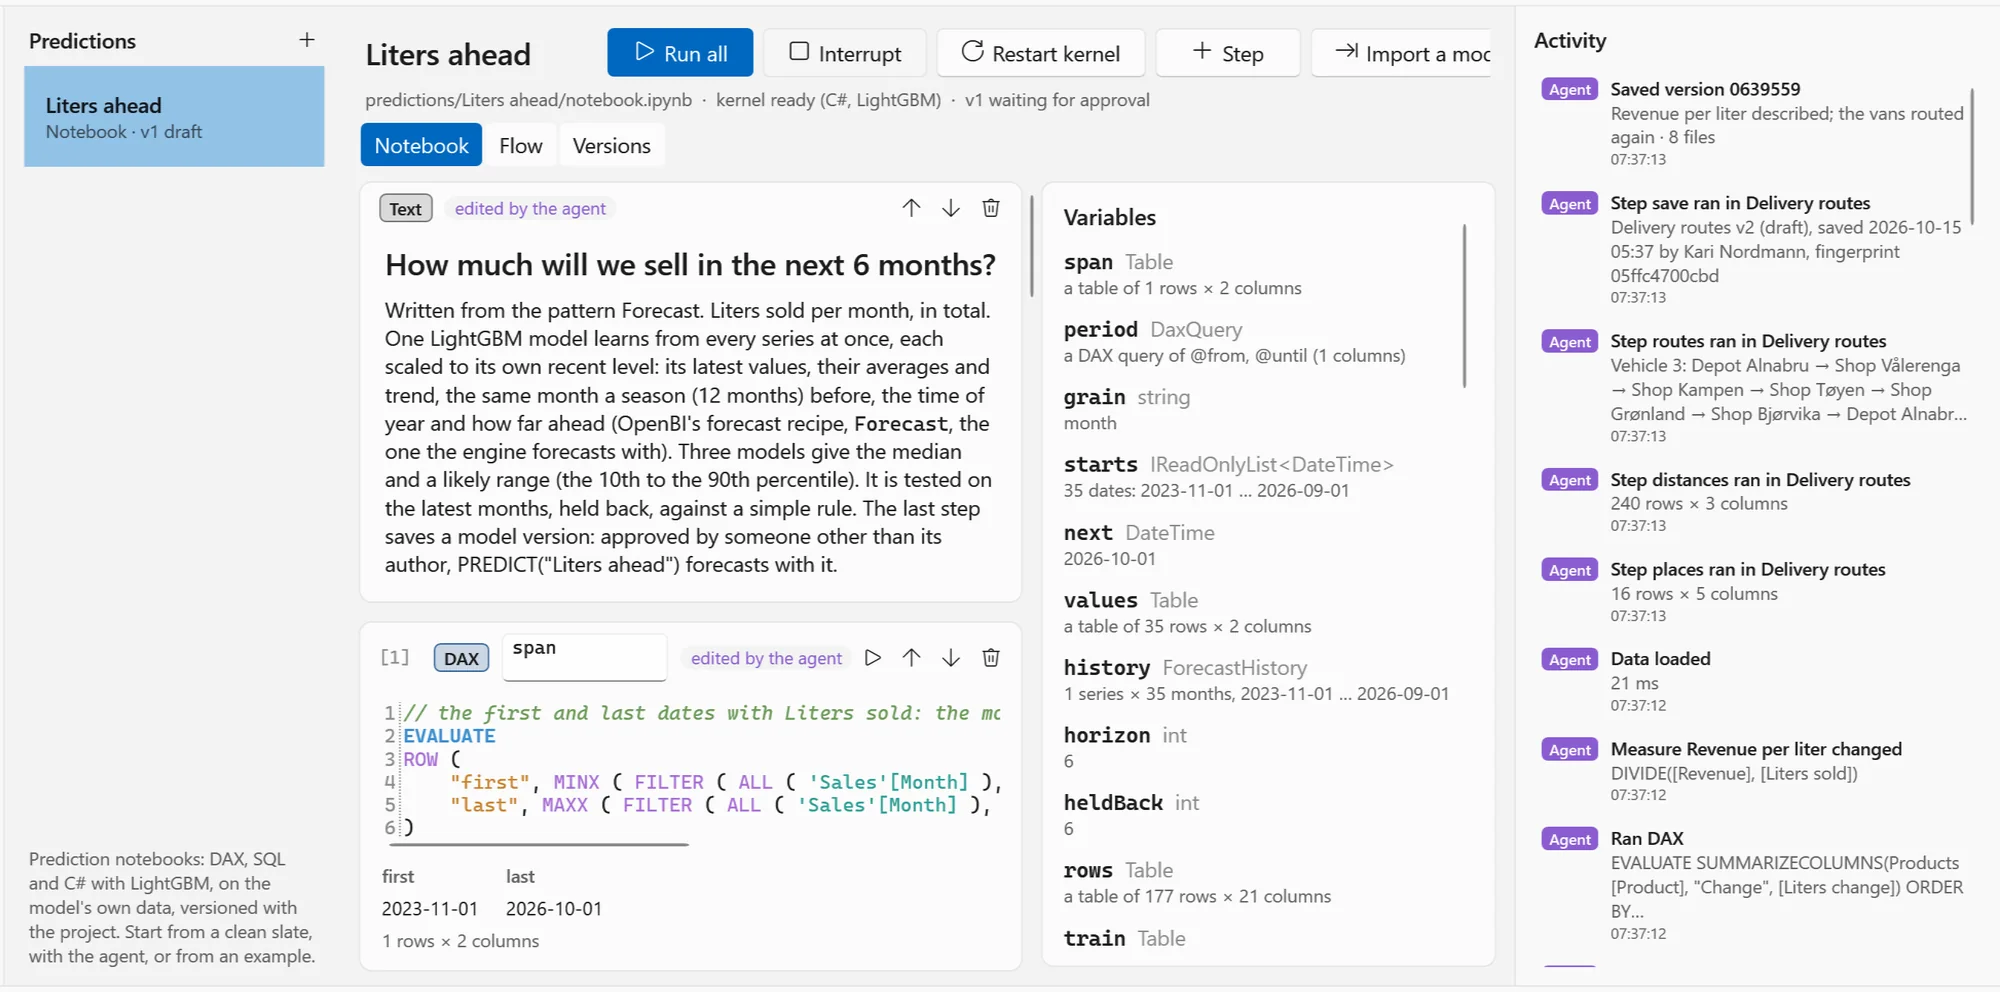
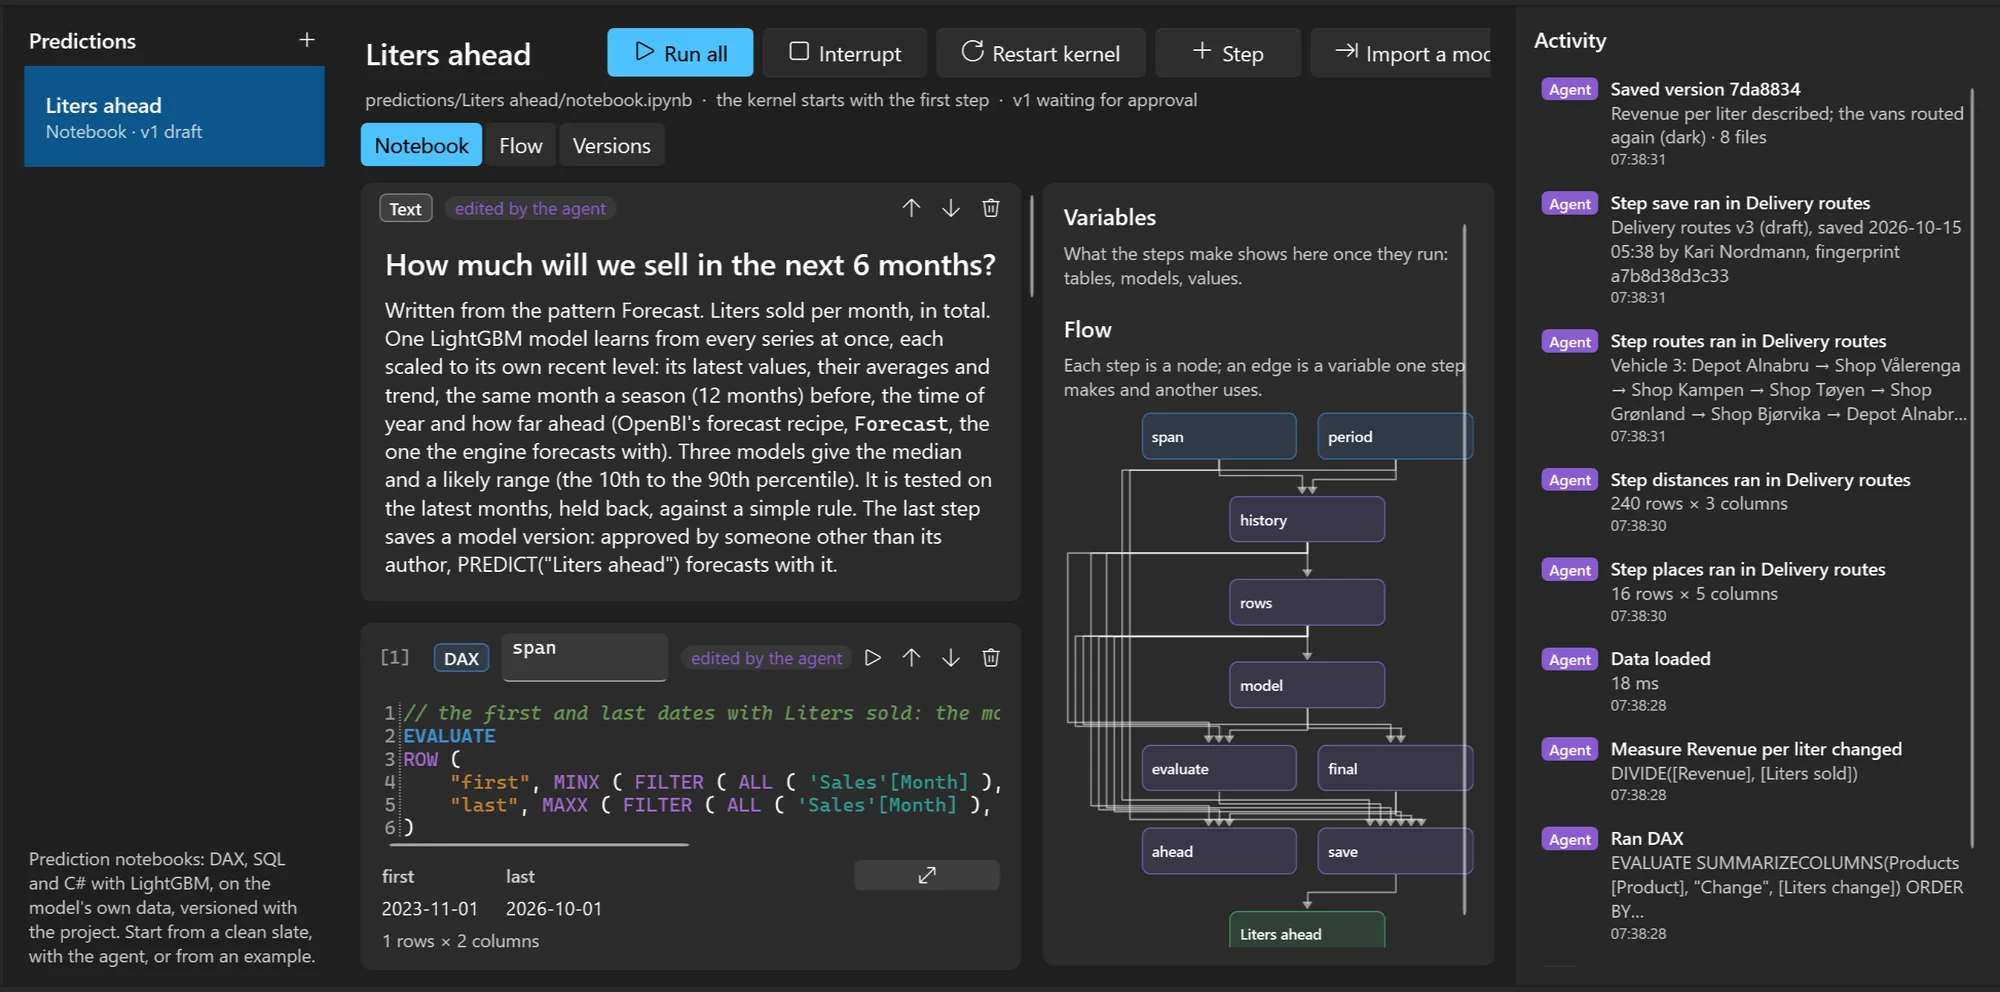
LightGBMHow much will we sell in the next 6 months? Strong: off by 2 % over the six months held back — a simple rule was off by 3 %. A person approves it before it forecasts in the model.
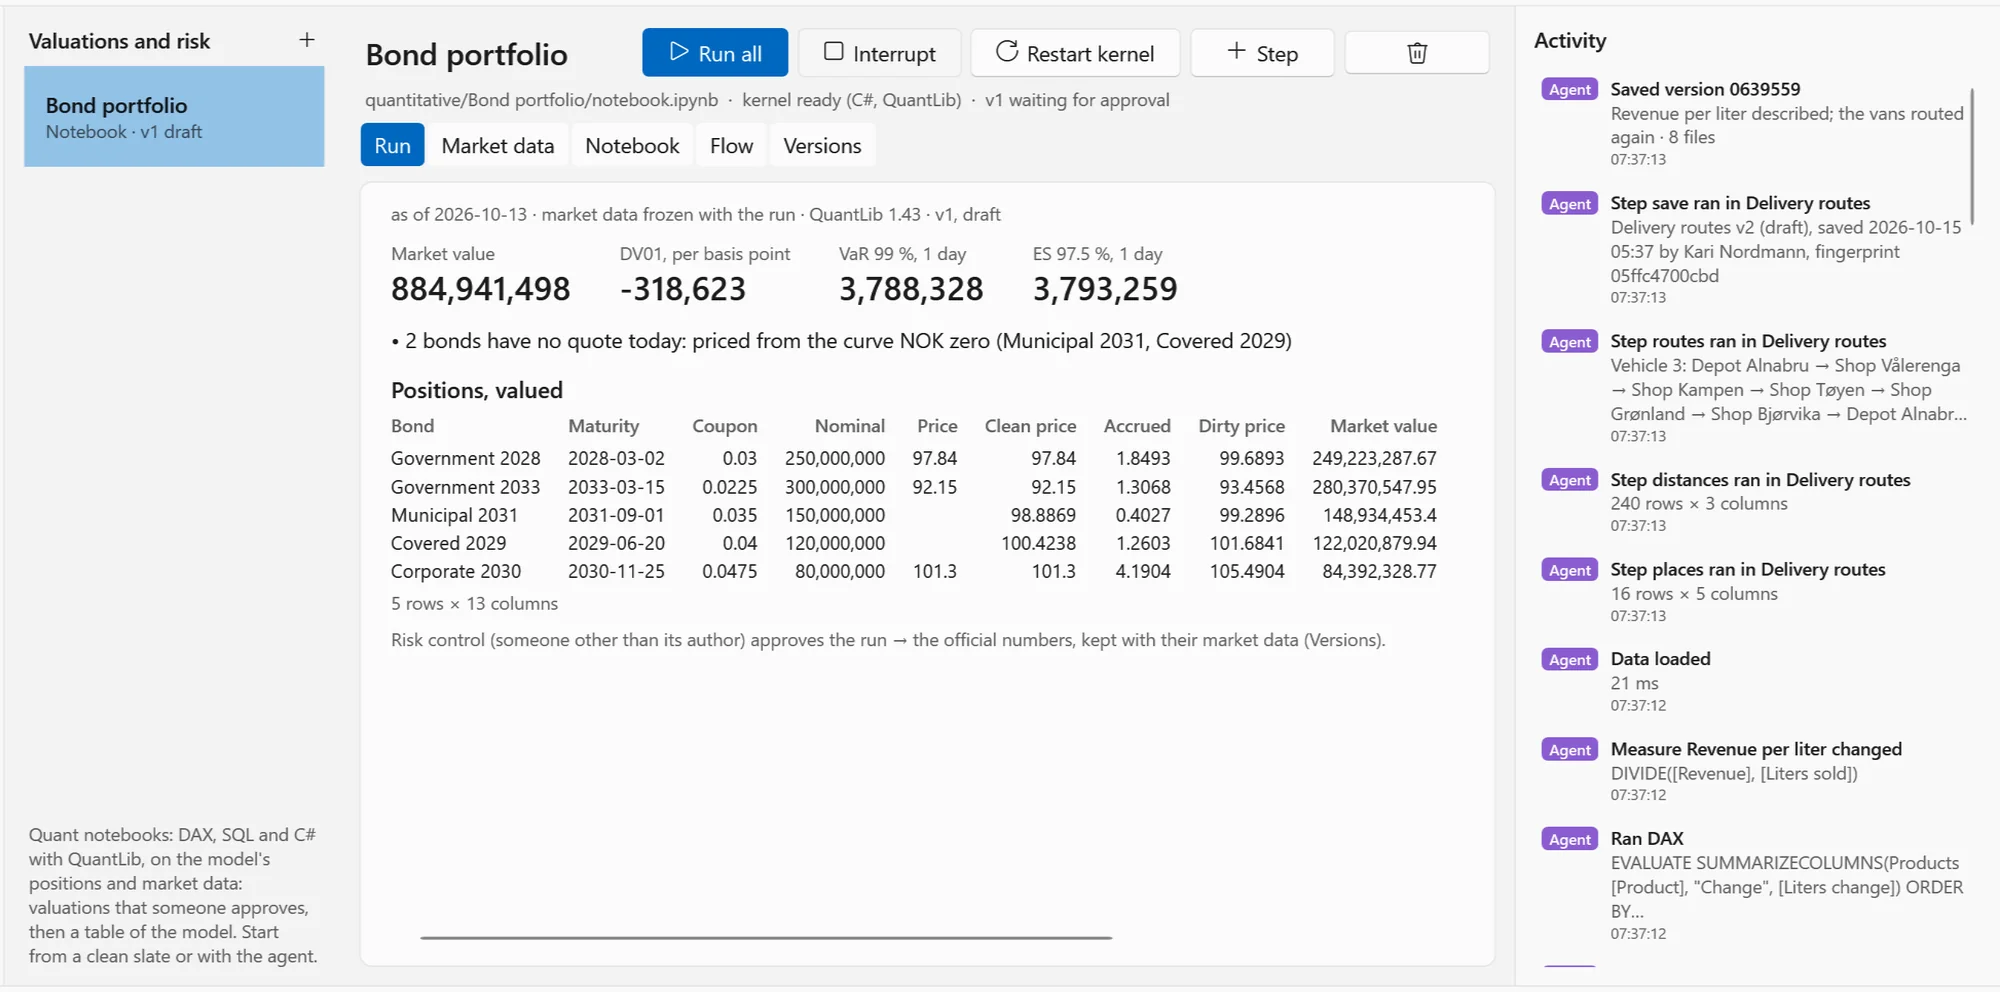
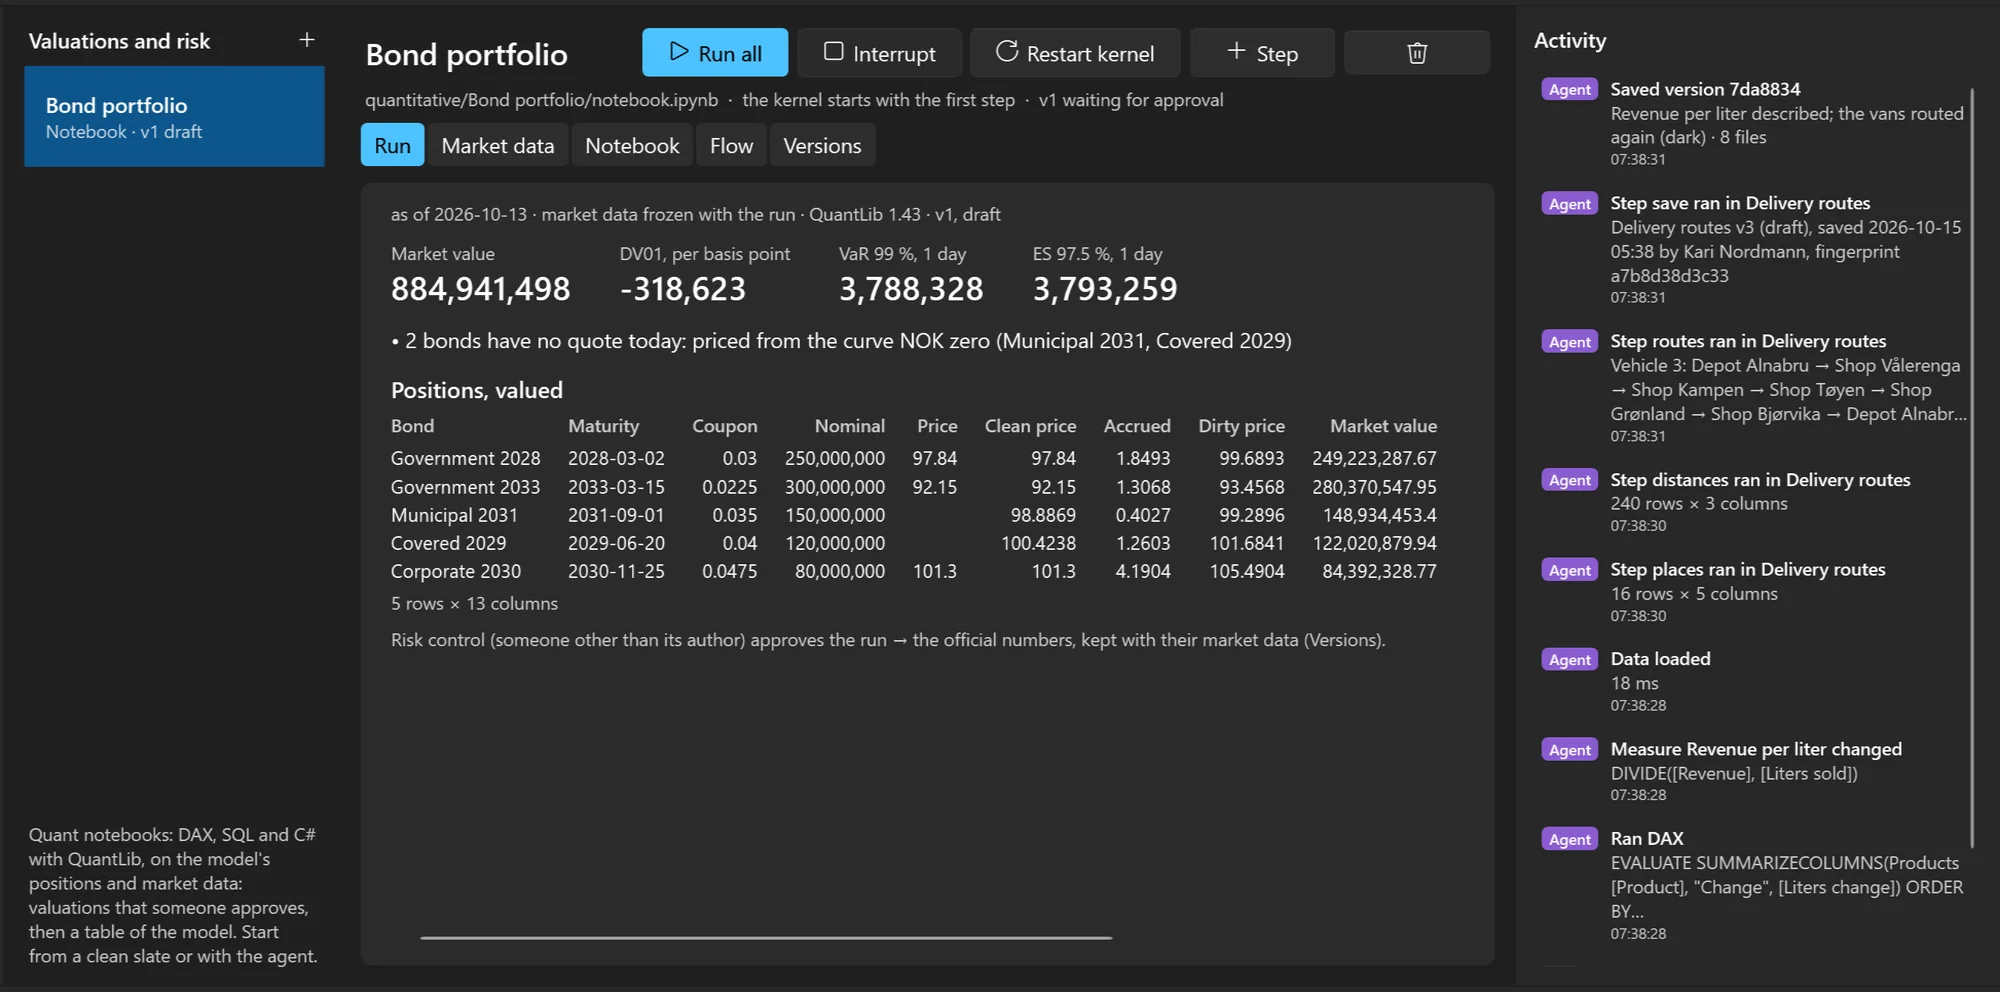
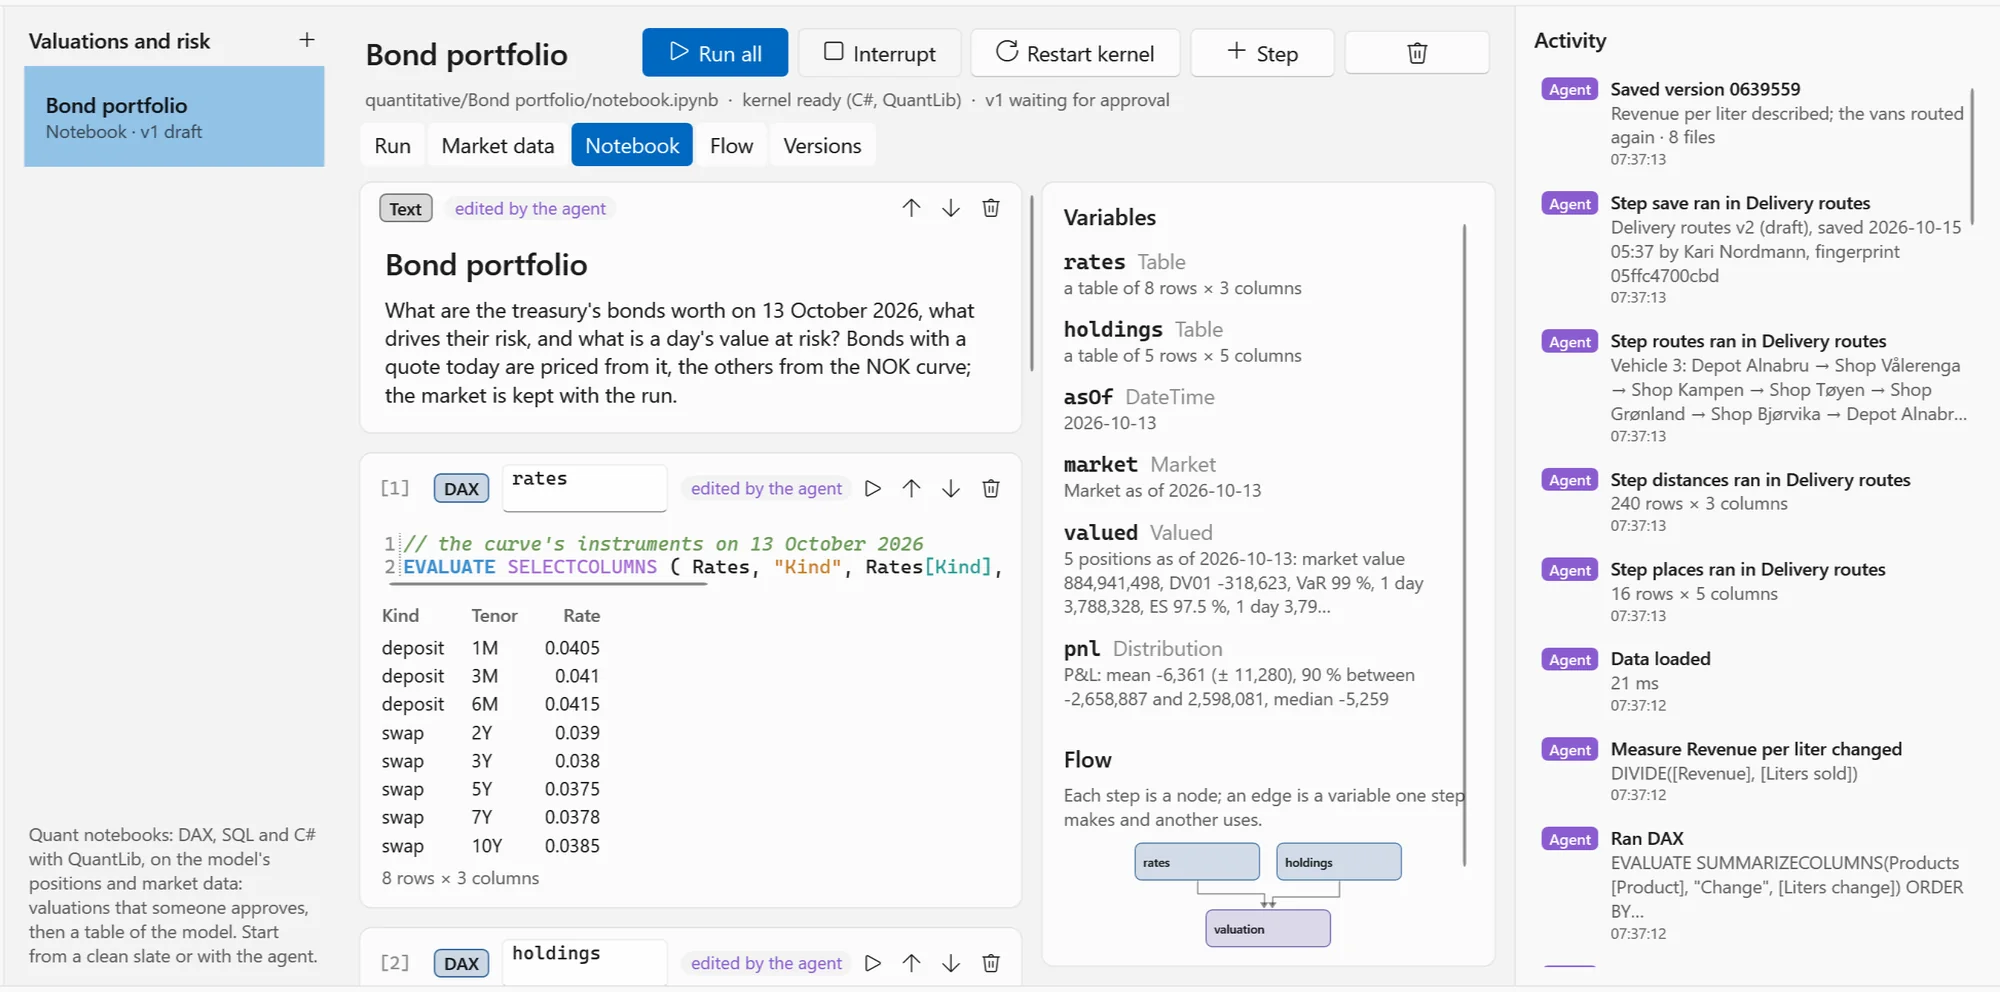
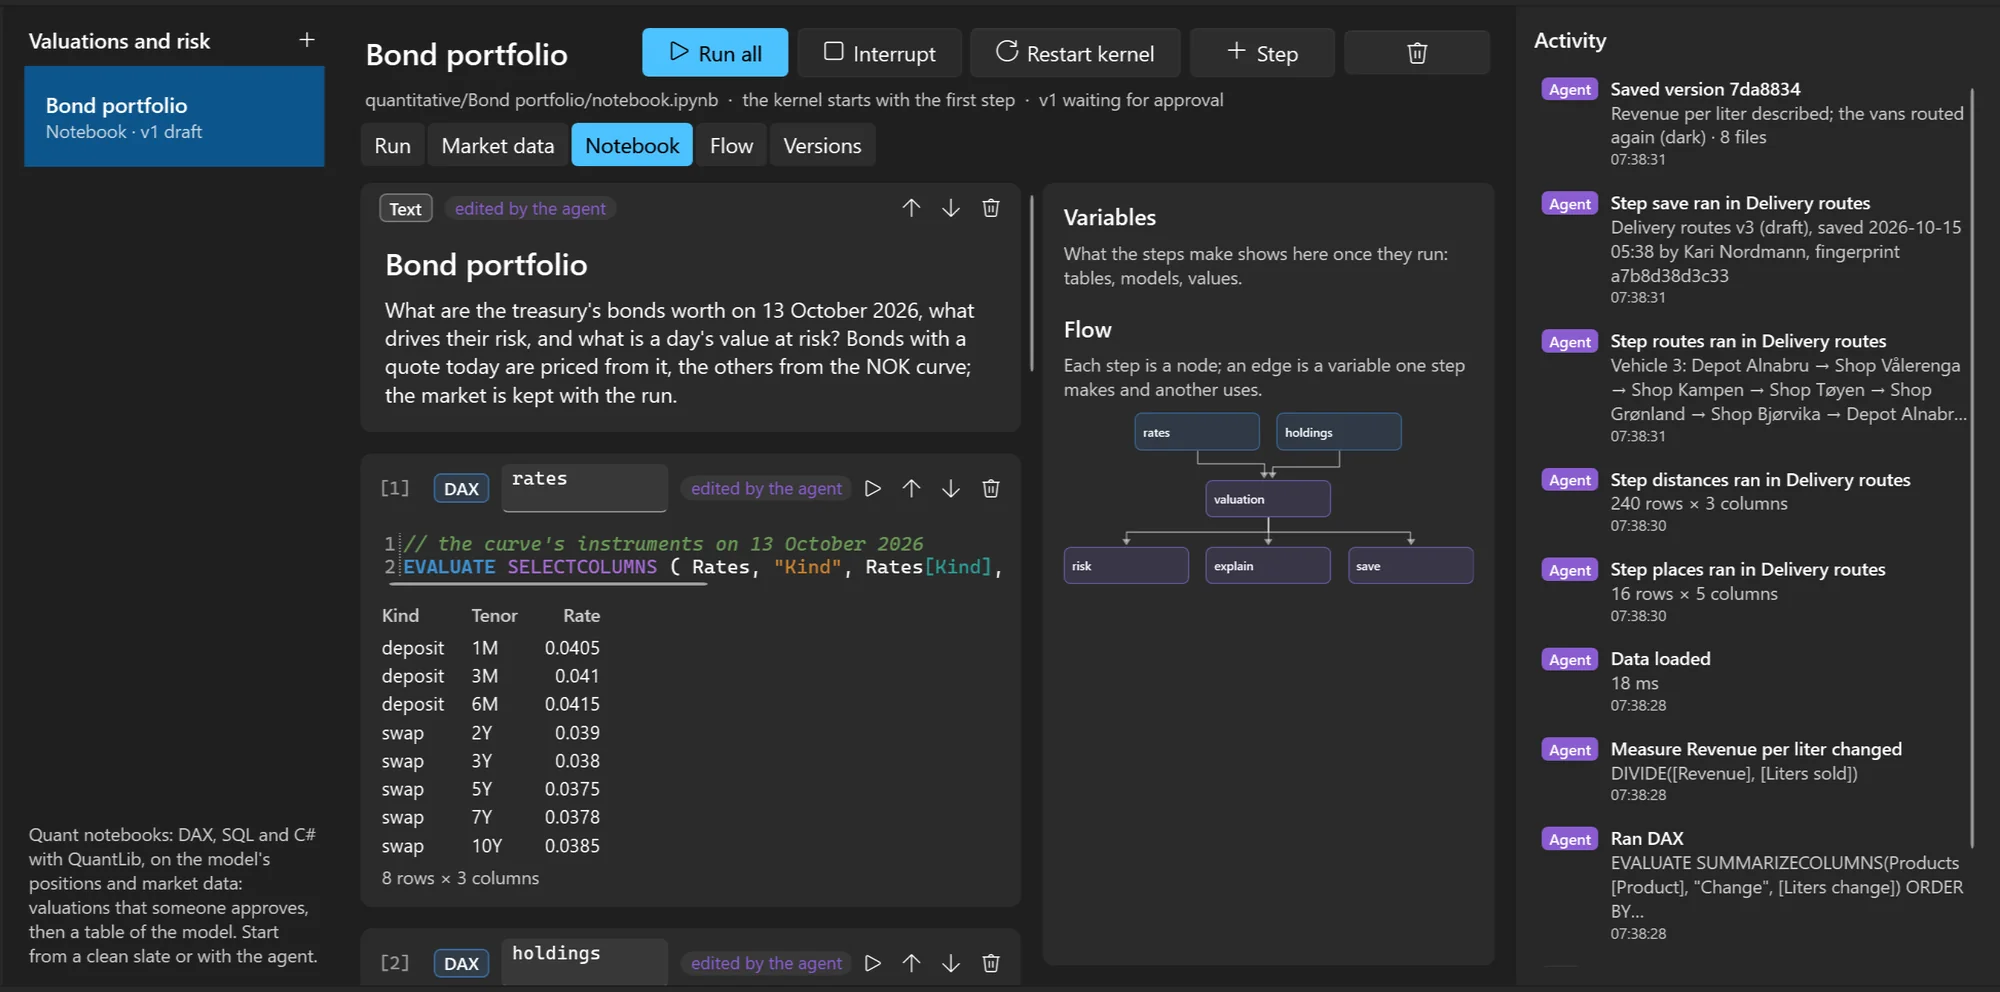
QuantLibWhat are the treasury's bonds worth, and what drives their risk? Market value 884.94 M, DV01 −318,623: a basis point costs 318,623. VaR 99 %, one day: 3.79 M.
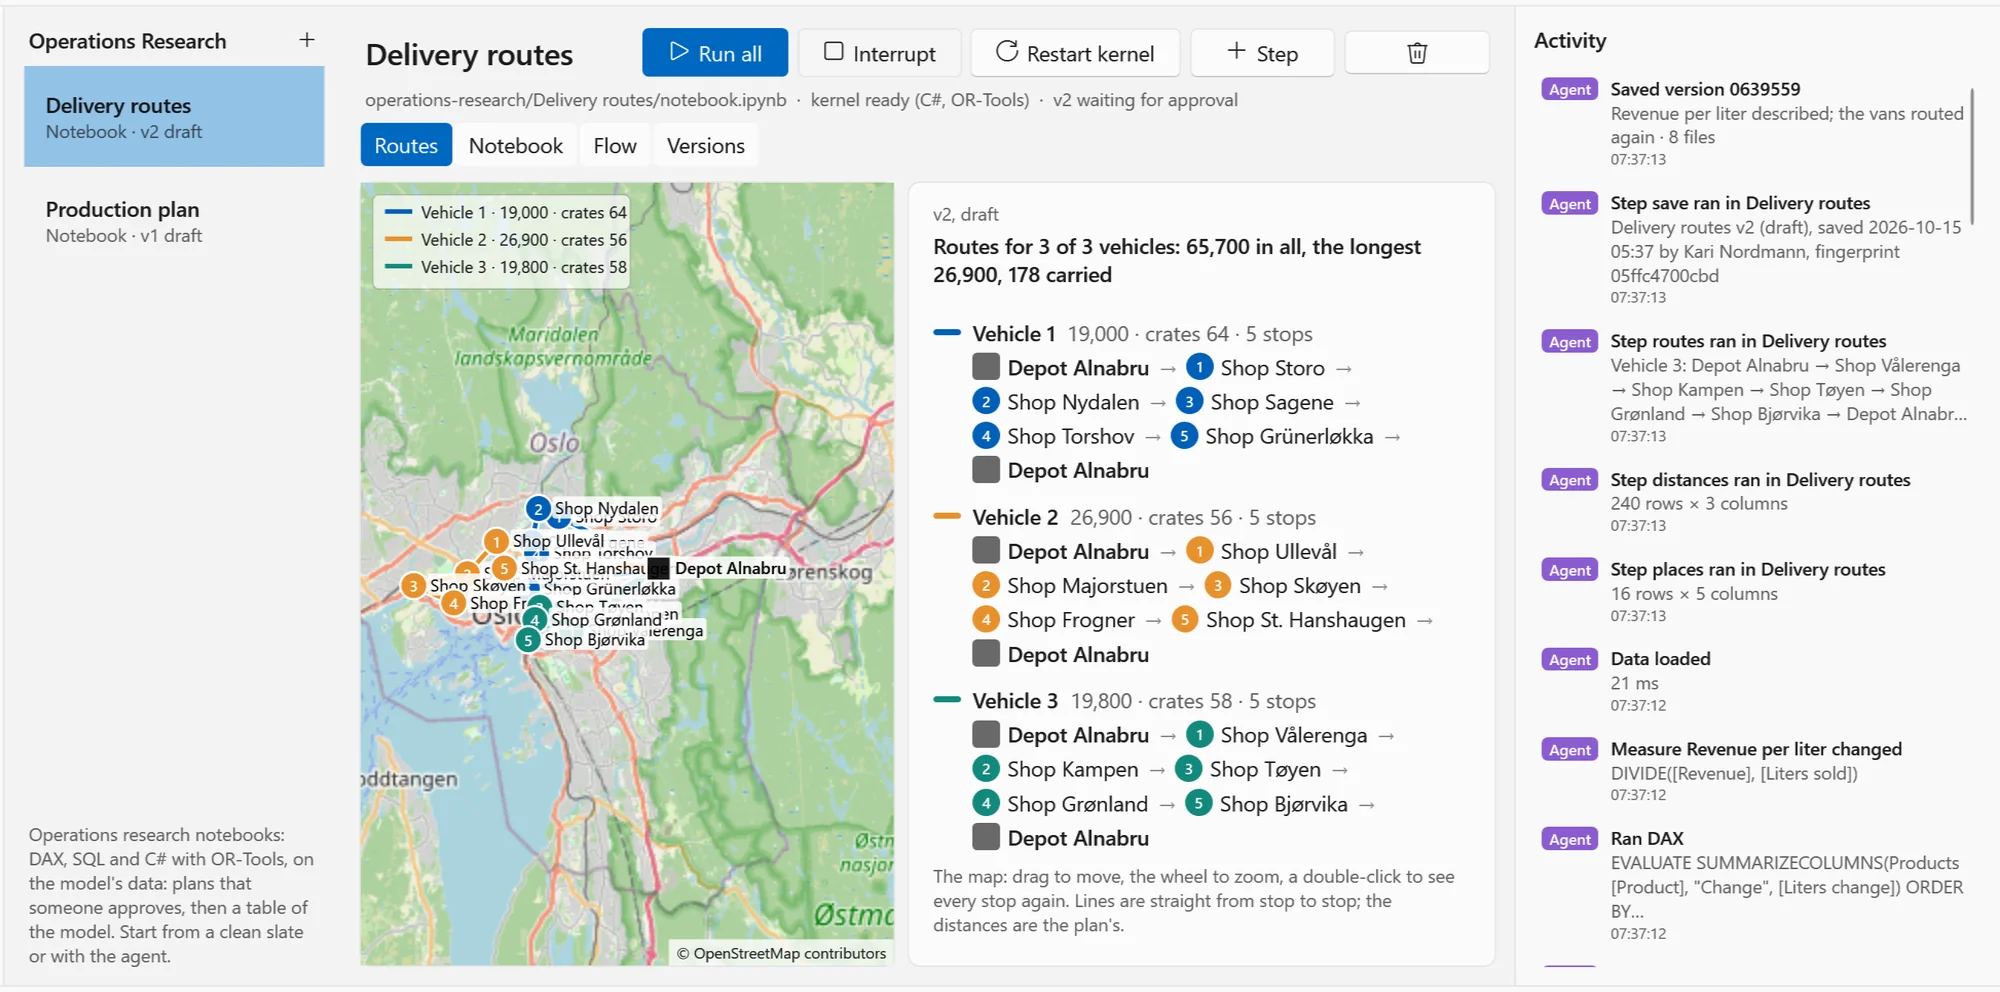
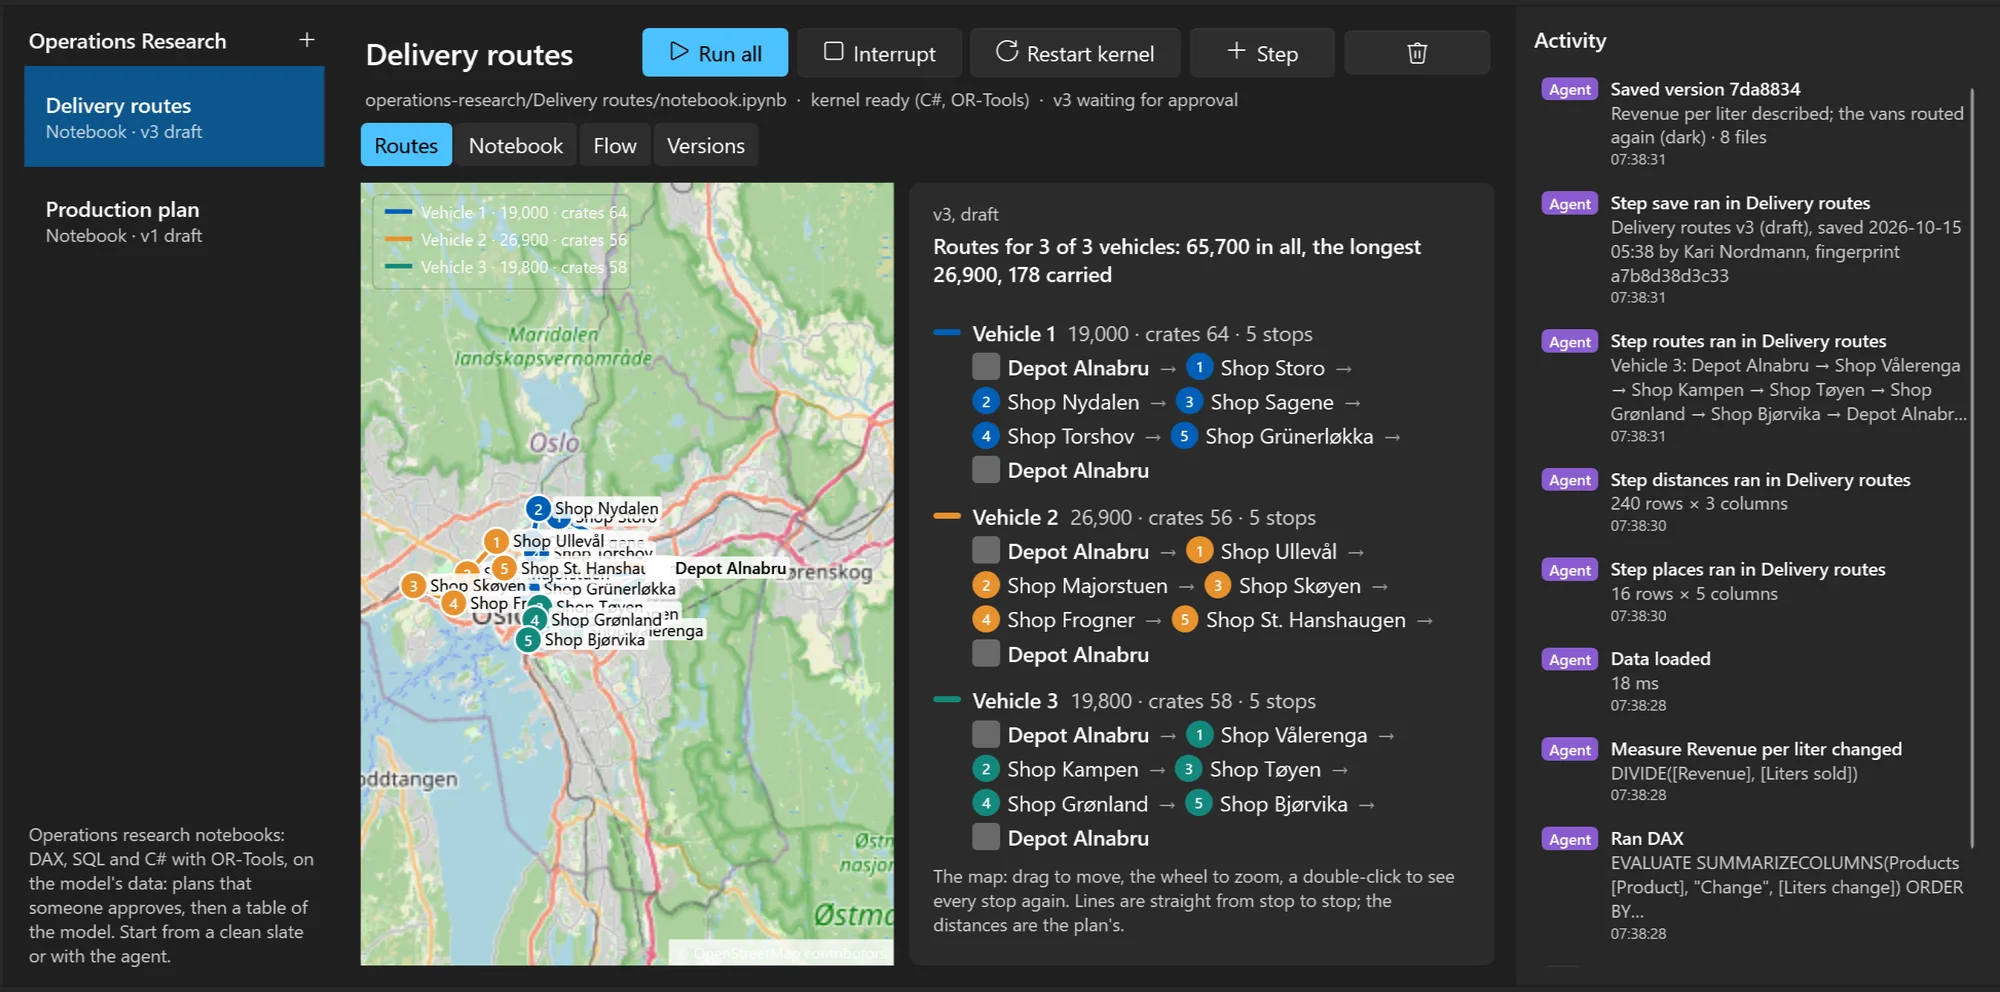
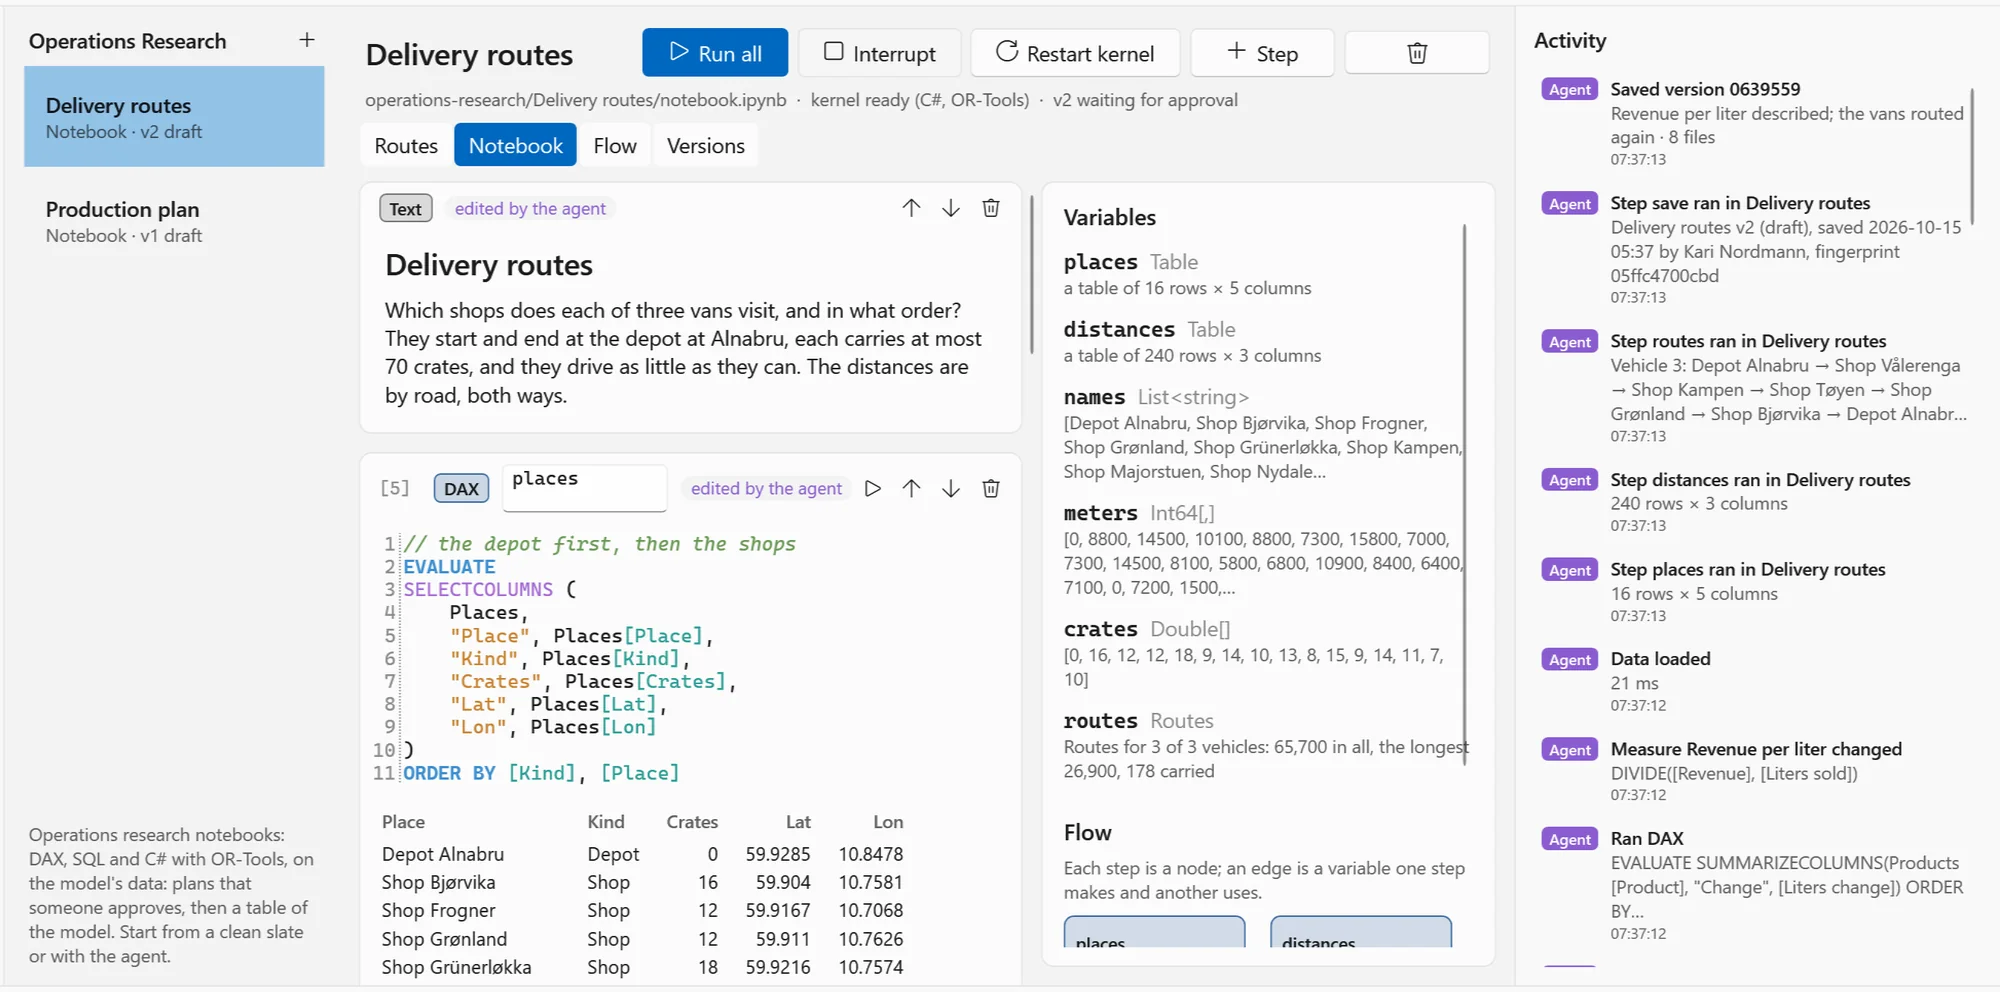
OR-ToolsWhich shops does each of three vans visit, and in what order? Three vans, sixteen shops, 65.7 km in all; the longest round is 26.9 km.
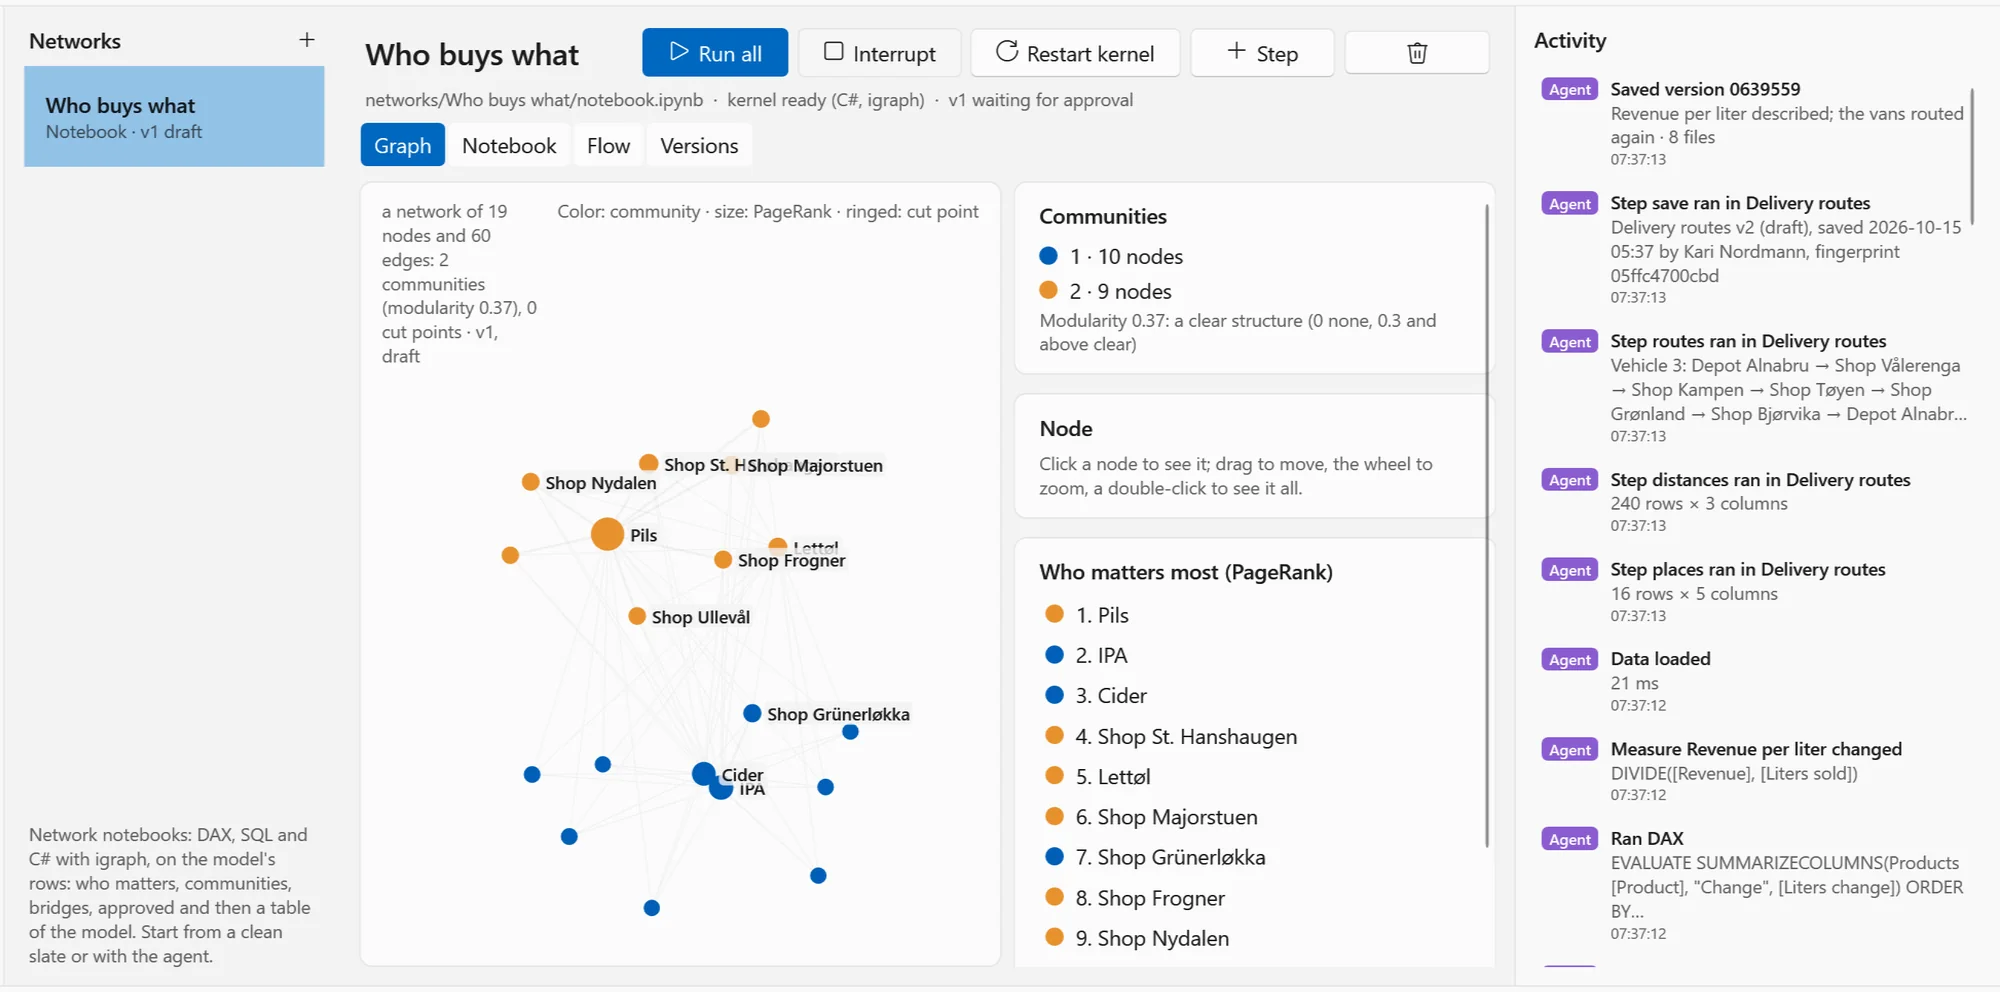
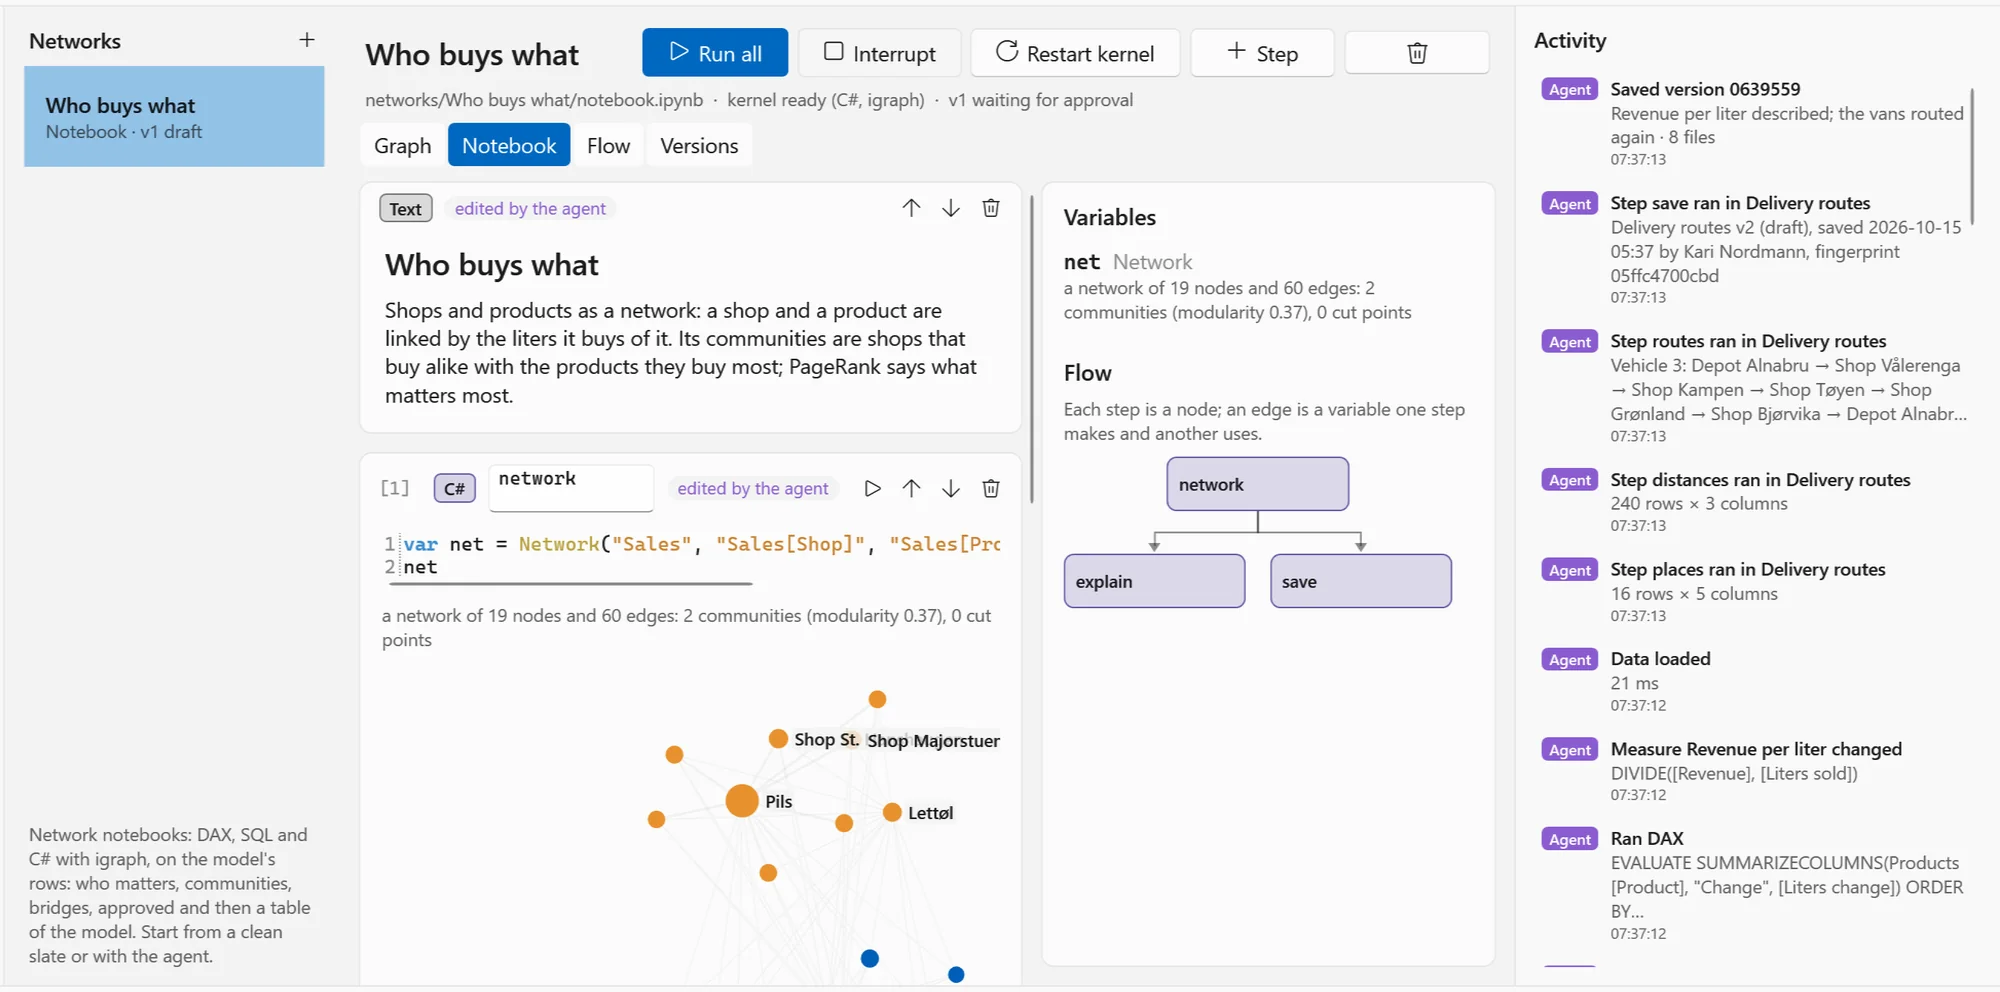
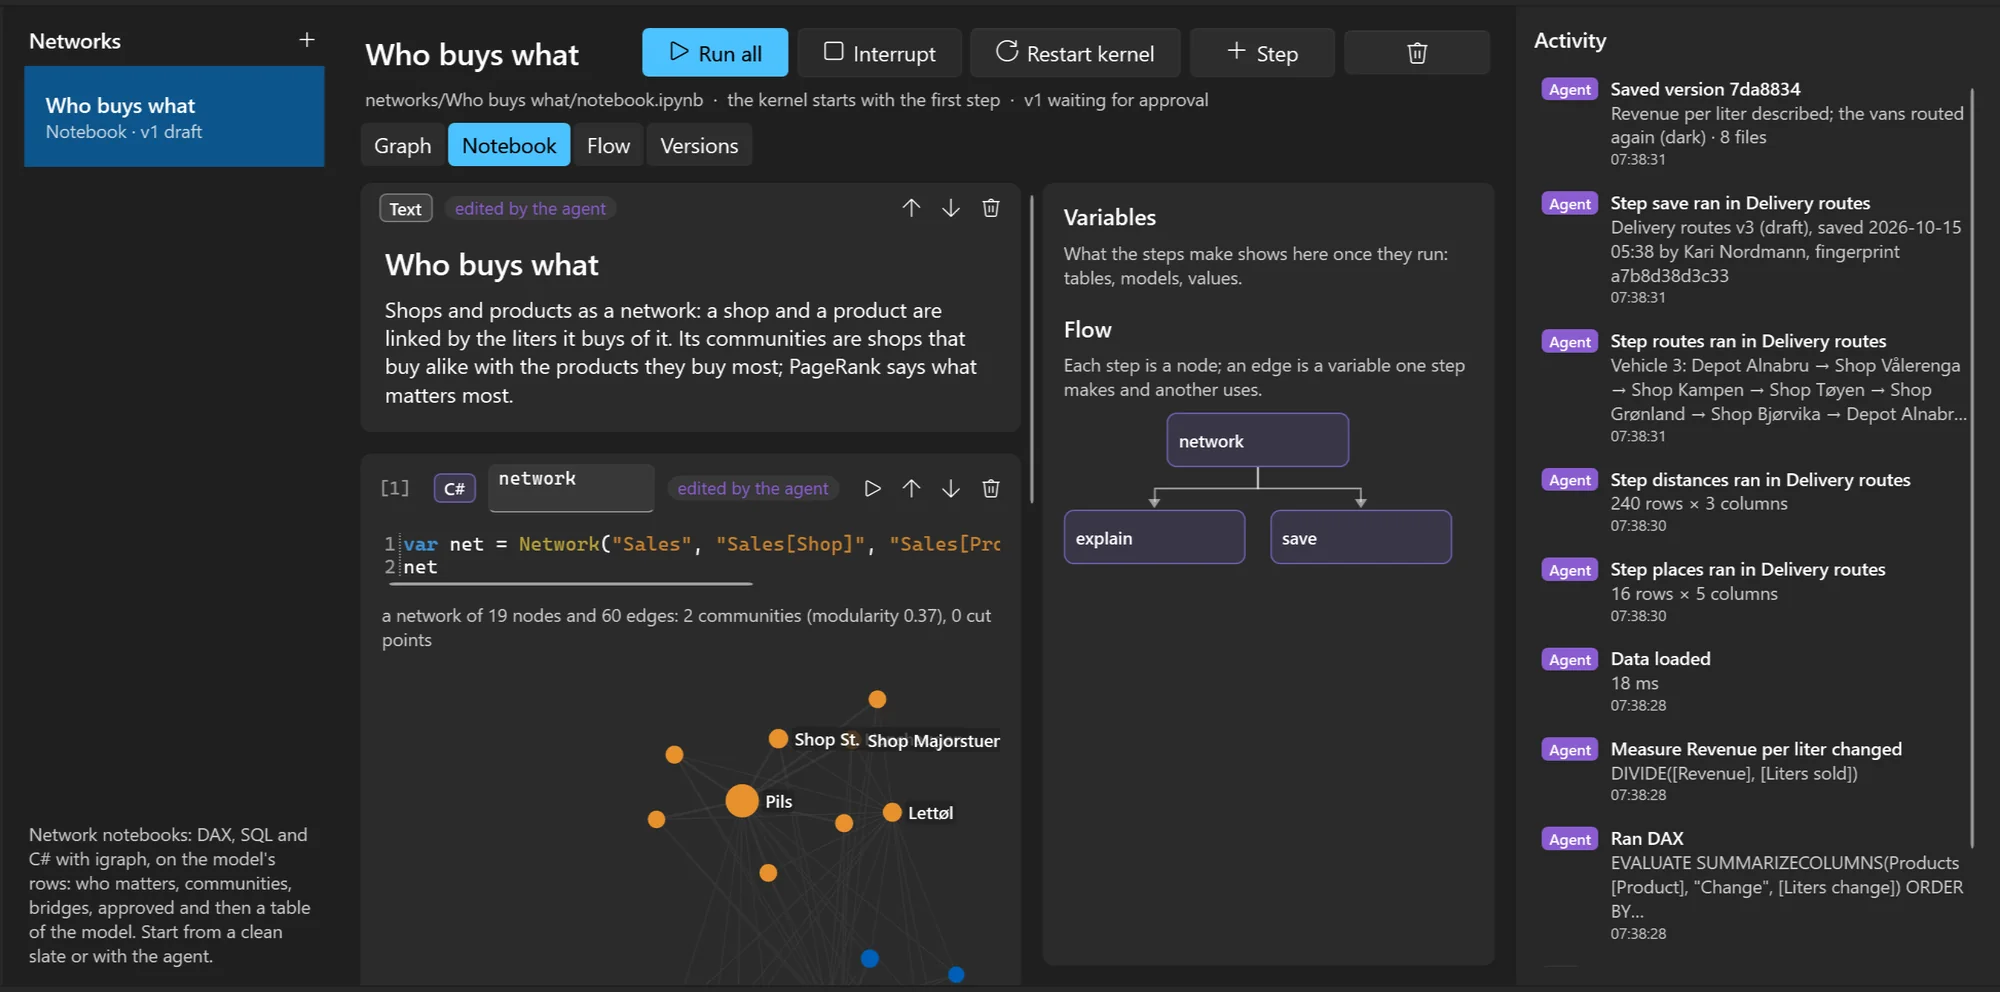
igraphWhich shops buy alike, and which products tie them together? Nineteen nodes, sixty edges, two communities; Pils, IPA and Cider matter most.
It runs on the cores you already have — your laptop, or a server of your own. Nothing to rent, nothing metered.
The agent saves drafts and never approves. Someone other than a version's author approves it before it is used.
The model, its notebooks, their versions and the reports: one project folder, one git history.
Security
Fewer moving parts, fewer surprises. No interpreter to patch, no package manager pulling code at run time — one installer, signed, with its bill of materials inside.
in the 45 components that ship, checked against OSV and NVD when the installer is built — a build with one stops.
OpenBI's executables and engine signed by Norway Analytics; a CycloneDX bill of materials installed with the studio.
Credentials stay with the studio. PDF typesetting runs in an empty folder that can read no file and fetch no package.
Excel
Click Analyze in Excel and a PivotTable opens, live on the model: Excel speaks to OpenBI the way it speaks to Analysis Services. Your CUBE formula dashboards can come right back.
| A | B | C | |
|---|---|---|---|
| 1 | Example Brewery | NOK / liters | |
| 2 | |||
| 3 | Revenue | Pils | 38,164,388 |
| 4 | Liters sold · Frogner | Pils | 115,604 |
| 5 | Liters sold · Frogner | IPA | 3,674 |
| 6 |
The figures are the model's answers to those queries, through MSOLAP — the provider Excel uses.
Coming from Power BI
30 million monthly users: Microsoft's own figure, from its 2025 recap. Power BI is a trademark of Microsoft; OpenBI is not affiliated with Microsoft.
Enterprise partner
Querex AS is OpenBI's Enterprise Partner. They connect an organization's databases, semantic models, files and APIs into one workflow — with the access you authorize — and put agents to work on it: from data to decisions in seconds.
Visit querex.no
 Enterprise Partner
Download
OpenBI is in alpha and changes fast — often from one week to the next. Tell us who you are, show us you're not a robot, and the installer is yours.
Your download has started.
If it hasn't, download the installer. The link works for 24 hours. When you run it, Windows names the publisher: Norway Analytics. Ro!